


A patient in shock has a blood pressure of 85/65 mmHg. The narrow pulse pressure suggests a small stroke volume.
Another has a pressure of 120/45 mmHg. The wide pulse pressure and low diastolic pressure suggest a hyperdynamic, vasodilated circulation.
Both interpretations are reasonable. But how confidently can we draw conclusions about flow and vascular tone from arterial pressure alone?
The pressure waveform results from ventricular ejection interacting with an arterial system that stores blood, allows it to run off into the peripheral circulation and transmits pressure waves. A given stroke volume can produce very different arterial pressures, while similar waveforms can arise from different circulatory states.
To understand what we can infer from the arterial trace, we first need to understand how that pressure is generated.
Then we’ll examine whether combining measurements into indices, particularly the diastolic shock index, can tell us anything more.
Pulse pressure: what are we actually measuring?
Pulse pressure is simply the difference between the highest and lowest arterial pressures during a cardiac cycle.
PP = systolic pressure − diastolic pressure
It is often interpreted as a reflection of stroke volume. A narrow PP suggests that relatively little blood is being ejected; a wide PP suggests a larger stroke volume.
There is a physical basis for this relationship, but it relies on assumptions about the arterial circulation that are rarely made explicit.
Where does pulse pressure come from?
Imagine the arterial circulation as an elastic reservoir with a continuous outlet to the peripheral circulation.
During ventricular ejection, blood enters this reservoir. At the same time, blood continues to leave through the peripheral circulation. Initially, ventricular inflow exceeds peripheral outflow, so blood accumulates in the arteries. Their walls distend, elastic energy is stored and arterial pressure rises.
As ventricular ejection slows, inflow eventually falls below outflow. Arterial pressure begins to decline, even though the ventricle may still be ejecting blood.
When the aortic valve closes, ventricular inflow stops altogether. Blood continues to leave the arterial compartment, its volume falls, and the elastic recoil of the arterial walls releases some of the energy previously supplied by the heart, maintaining pressure and forward flow during diastole.
We can describe this with a simple volume balance:
C × dP/dt = Qin − Qout
Here, C is arterial compliance, dP/dt is the rate of change of arterial pressure, Qin is blood entering from the ventricle and Qout is blood leaving through the peripheral circulation.
In other words, arterial pressure rises when inflow exceeds outflow and falls when outflow exceeds inflow. Compliance determines how much pressure changes for a given change in stored arterial volume.
Compliance describes the relationship between a change in arterial volume and the resulting change in pressure:
C = ΔV / ΔP
Rearranging:
ΔP = ΔV / C
For a given increase in stored arterial volume, a less compliant arterial system develops a greater pressure rise.
This leads to the commonly taught approximation:
PP ≈ SV / C
Pulse pressure is approximately stroke volume divided by arterial compliance.
But there is an assumption hidden in that equation. It treats the entire stroke volume as though it were added to the arterial reservoir before any blood escaped. In reality, blood is leaving throughout ventricular ejection.
The increase in arterial volume between minimum and maximum pressure is therefore the volume entering during that interval minus the volume leaving over the same interval. This is the volume that actually produces the pressure excursion in our simplified model.
The approximation becomes exact in an idealised model with constant compliance and instantaneous ventricular ejection. Real ventricular ejection takes a substantial fraction of the cardiac cycle, during which peripheral runoff continues.
Why does a larger stroke volume increase pulse pressure?
Suppose stroke volume increases while arterial compliance, peripheral resistance and heart rate remain unchanged.
More blood enters the arterial compartment with each heartbeat. During ejection, this produces a greater accumulation of blood and therefore a greater rise in arterial pressure.
But that additional blood does not remain in the arteries. Peripheral runoff continues during systole and diastole, removing some of the accumulated volume before the next heartbeat.
Consequently, the additional arterial volume present at peak systole is greater than the additional volume remaining at the end of diastole. The pressure difference between these two points increases.
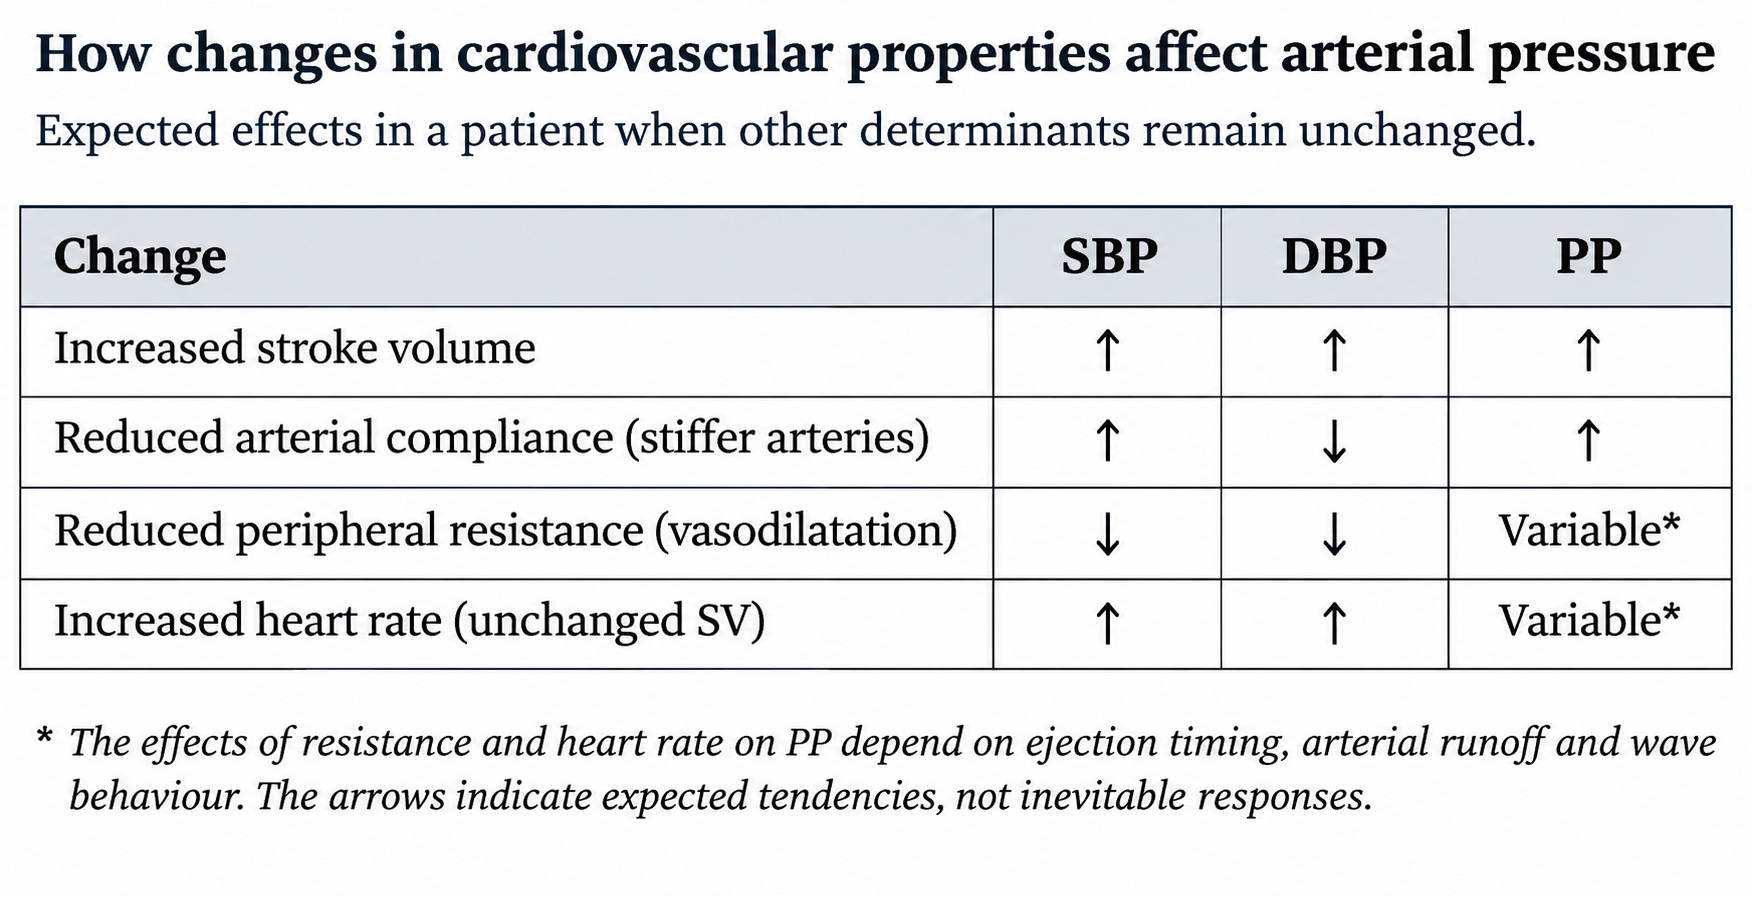
In a sustained higher-output state, both systolic and diastolic pressures rise. Greater cardiac output produces a higher mean arterial pressure when peripheral resistance is unchanged. But systolic pressure rises more because each ventricular ejection produces a larger excursion in arterial volume.
This explanation does not require the arteries to become stiffer during systole. It works even if arterial compliance is perfectly constant. Arteries do become less compliant as they distend, which can amplify the pressure rise. But the fundamental mechanism is simpler: ventricular inflow is pulsatile, peripheral outflow is continuous, and the arteries temporarily store some of the blood ejected during each heartbeat.
Pulse pressure is therefore the pressure excursion produced by ventricular ejection interacting with arterial storage and runoff, not a direct measurement of the volume ejected.
The same stroke volume, different pulse pressures
Consider two patients ejecting identical stroke volumes.
One has relatively compliant arteries. As blood enters, the arterial walls expand relatively easily, accommodating the additional volume with a modest rise in pressure.
The other has stiff arteries. The same additional volume produces less expansion and a greater rise in pressure.
Recall:
ΔP = ΔV / C
For the same increase in stored arterial volume, halving compliance doubles the pressure rise.
Two patients with identical stroke volumes can therefore have substantially different pulse pressures simply because their arterial systems have different mechanical properties.
This is particularly relevant with ageing. Large elastic arteries, especially the aorta, progressively stiffen as their structure changes and therefore become less able to accommodate changes in volume without large changes in pressure.
The same ventricular ejection consequently produces a larger pressure excursion. This contributes to the wide pulse pressures commonly seen in older patients, even when stroke volume is entirely normal.
Arterial compliance is also not a fixed property.
The arterial pressure–volume relationship is nonlinear. At relatively low pressures, the arterial wall is more compliant. As pressure and distension increase, progressively more load is borne by stiffer collagen fibres, so further expansion produces a greater rise in pressure.
The same artery can therefore have different compliance at different operating pressures. Increasing mean arterial pressure can move the circulation onto a stiffer part of its pressure–volume relationship, producing a larger pulse pressure for the same stroke volume.
The pressure at which arterial stiffness is assessed therefore influences the apparent stiffness, even without a structural change in the vessel wall.
Compliance is not resistance
Compliance describes the change in arterial volume associated with a change in pressure. Resistance describes the pressure drop associated with a given flow.
The large elastic arteries provide most of the arterial system’s capacity to temporarily store blood. The small arteries and arterioles provide most of the resistance to steady flow.
The distinction is not absolute: large arteries have vascular smooth muscle and smaller vessels contribute some compliance. But it explains why ageing and vasodilatation have different effects on arterial pressure.
An elderly patient may have stiff arteries and a wide pulse pressure without particularly high peripheral resistance. Conversely, a patient with septic shock may have profound arteriolar vasodilatation and low peripheral resistance without a corresponding increase in the compliance of the large arteries. The two properties can change independently.
Resistance, runoff and diastolic pressure
The arterial reservoir is continuously losing blood into the peripheral circulation. How rapidly it loses that blood influences the pressure waveform.
Peripheral resistance is predominantly determined by the calibre of the small arteries and arterioles. Vasoconstriction increases resistance; vasodilatation reduces it.
For a given arterial pressure state, reducing peripheral resistance allows more blood to pass through the resistance vessels. Blood therefore leaves the compliant arterial compartment more rapidly.
During diastole, when ventricular inflow has stopped, this loss of arterial volume produces a progressive fall in pressure.
The rate of pressure decline depends on resistance and compliance together. In the simplified Windkessel model, their combined effect is described by a time constant:
τ = R × C
Here, τ is the time constant, R is peripheral resistance and C is total arterial compliance.
A higher resistance slows arterial runoff. Greater compliance means that a given loss of volume produces a smaller pressure fall. Both therefore slow the decline in arterial pressure.
Conversely, reducing resistance or compliance shortens the time constant and produces a faster pressure decline.
In this simplified model, arterial pressure approaches its downstream pressure level exponentially. After one time constant, approximately 37% of the original pressure difference remains.
Diastolic pressure therefore depends partly on the pressure remaining after the preceding ventricular ejection and how quickly that pressure declines before the next heartbeat.
Heart rate also influences the result.
As heart rate increases, diastole generally becomes shorter. There is less time for arterial runoff before the next ejection, tending to preserve diastolic pressure when other conditions are unchanged.
At a slower heart rate, diastole lasts longer, allowing more blood to leave and pressure to fall further.
Of course, changes in heart rate may also alter stroke volume and cardiac output, so these effects cannot always be separated clinically.
Does vasodilatation widen pulse pressure?
We commonly associate vasodilatory shock with a low diastolic pressure and a wide pulse pressure. It is tempting to conclude that vasodilatation widens PP because blood runs off more rapidly during diastole. But this is incomplete.
Reducing peripheral resistance accelerates arterial runoff at a given pressure. It also reduces the average pressure maintained in the arterial compartment for a given cardiac output.
However, runoff occurs during systole as well as diastole.
If more blood leaves during ventricular ejection, less of the ejected volume is temporarily stored in the arteries. For a given stroke volume and compliance, this can reduce the systolic pressure excursion.
The simplest Windkessel model makes this particularly clear.
Imagine that the entire stroke volume enters the arterial compartment instantaneously. There is no time for peripheral runoff during ejection.
In that idealised situation:
PP = SV / C
Peripheral resistance does not appear in the equation.
Changing resistance alters mean arterial pressure and the rate of diastolic pressure decay, but not the difference between maximum and minimum pressure.
Real ventricular ejection is not instantaneous. Resistance can therefore influence pulse pressure, but its effect depends on the timing of ejection and the interaction between inflow, outflow and arterial storage.
A fall in diastolic pressure does not, by itself, mean that pulse pressure must widen. Systolic pressure may also fall.
In septic shock, low resistance can coexist with a wide pulse pressure if stroke volume is large, or a narrow one if stroke volume is small. Vasodilatation alone does not determine the result.
Beyond the elastic reservoir
Real arteries are not a single elastic chamber. They form a branching network of elastic tubes through which pressure waves travel.
When the LV ejects blood into the aorta, it does more than increase the volume stored in the arterial circulation. It also generates a pressure and flow wave that propagates along the arterial system.
As the wave travels, it produces changes in pressure and blood velocity at successive points along the arteries. The wave travels much faster than the blood itself, so blood already present further downstream begins moving differently long before the blood ejected from the ventricle reaches it.
The pressure generated by ventricular ejection depends partly on the properties of the proximal aorta. This relationship is described by characteristic impedance.
Characteristic impedance describes the relationship between the pressure and flow components of a forward-travelling wave, before reflected waves are considered.
For a given flow wave, a higher characteristic impedance produces a larger pressure wave. It depends on arterial dimensions and stiffness, particularly the mechanical properties and diameter of the proximal aorta.
This introduces another influence on pulse pressure: how quickly blood is ejected, not simply how much is ejected.
Two ventricles delivering identical stroke volumes can generate different pressure waveforms if one ejects that volume more rapidly.
When a travelling wave encounters a change in impedance, such as at a branch or a change in arterial stiffness, part may be reflected while the remainder continues onwards.
Reflected waves interact with forward-travelling waves. Depending on their amplitude and timing, they alter the pressure measured at a particular location.
A backward-travelling pressure wave can, for example, increase local pressure while opposing forward flow.
This explains why pulse pressure depends on where it is measured.
Systolic pressure and pulse pressure are often higher in peripheral arteries, such as the radial artery, than in the central aorta. This peripheral amplification results from changes in wave transmission and reflection. Mean arterial pressure generally changes much less.
A patient can therefore have different pulse pressures in the aorta and radial artery despite having exactly the same stroke volume.
The Windkessel model remains useful because it explains arterial storage and runoff. But it cannot fully describe the waveform at a particular arterial location.
Pulse pressure depends on the volume ejected, the rate of ejection, the elastic properties of the arteries and the behaviour of pressure waves travelling through them.
What does a wide or narrow pulse pressure actually tell us?
We now have a problem.
Pulse pressure is influenced by stroke volume, arterial compliance, peripheral resistance, ventricular ejection timing and wave transmission. But when we look at an arterial pressure of 130/60, we see only their combined result.
Can we reliably work backwards from that result to identify what is happening in the circulation?
A wide pulse pressure
Consider an elderly patient with a blood pressure of 160/70 mmHg.
Their PP is 90 mmHg. That is very wide, but it does not necessarily indicate a large stroke volume.
With ageing, the large elastic arteries become stiffer. The same volume entering the arterial compartment produces a larger pressure rise, while changes in wave transmission and reflection can further increase systolic pressure. The ventricle may be ejecting an entirely ordinary stroke volume.
Now consider a younger patient with a similarly wide PP during hyperdynamic septic shock.
The mechanism may be quite different. Stroke volume may be increased, producing a larger pressure excursion, while reduced peripheral resistance contributes to a low diastolic pressure.
Aortic regurgitation provides another example. The LV ejects both the effective forward stroke volume and the volume that will subsequently regurgitate. Increased total LV ejection can raise systolic pressure, while blood returning through the incompetent aortic valve contributes to the fall in diastolic pressure.
Three different mechanisms, potentially the same PP. And they can coexist: an elderly patient with septic shock may have stiff arteries, reduced peripheral resistance and a small stroke volume simultaneously.
A wide pulse pressure does not establish that stroke volume is high.
What about a narrow pulse pressure?
Now suppose a patient with circulatory shock has a blood pressure of 85/65 mmHg, giving a PP of just 20 mmHg.
A small stroke volume is an obvious possibility. If little blood enters the arterial compartment with each ejection, there is relatively little additional volume to produce a systolic pressure excursion.
This is particularly suggestive in an older patient whose arteries are likely to be relatively stiff. Reduced arterial compliance should, if anything, generate a greater pressure excursion for a given stroke volume. A narrow PP despite stiff arteries therefore strengthens the suspicion that stroke volume is small.
There is some evidence supporting this interpretation. A 2025 review by Putowski and colleagues presented a secondary analysis of 359 critically ill patients in whom PP below 40 mmHg identified a low LVOT velocity–time integral with high specificity, particularly in patients over 65.
However, the analysis was not published as a separate study, and its diagnostic performance cannot be assumed in other settings.
A narrow PP is not a direct measurement of stroke volume either. Arterial compliance, ventricular ejection characteristics and measurement site still influence the result. Severe aortic stenosis, for example, can produce a narrow PP through reduced and prolonged ventricular ejection.
Nor does a small stroke volume necessarily mean low cardiac output. Cardiac output also depends on heart rate. And even when PP does reflect a small stroke volume, it cannot tell us why. Inadequate filling, impaired ventricular function or an excessive load against which the ventricle must eject can all produce the same finding.
Before drawing any conclusions from an invasive arterial waveform, we should also be confident that it is accurate. An underdamped arterial monitoring system can exaggerate systolic pressure and underestimate diastolic pressure, artificially widening PP. Overdamping can attenuate the systolic peak and narrow PP. Mean arterial pressure is generally less affected by these distortions. The pressure waveform displayed on the monitor is not necessarily the waveform that actually exists inside the artery.
The accompanying diastolic pressure provides some additional context. Consider two patients with pressures of 100/80 and 70/50 mmHg. Both have a PP of 20 mmHg, potentially suggesting small stroke volumes, but their underlying arterial pressure levels are quite different.
In the first, arterial pressure is relatively well maintained. This could reflect increased vascular resistance, a heart rate sufficient to maintain cardiac output, or both. In the second, the lower pressure could reflect reduced vascular resistance, severely reduced cardiac output or a combination.
Without knowing flow, we cannot determine vascular resistance from either pressure. And neither tells us which physiological constraint is limiting stroke volume, or whether increasing cardiac filling would improve it.
So PP can provide useful clues, particularly when it is unusually narrow. DBP adds some information about the arterial pressure state, but still cannot identify the underlying mechanism.
Perhaps combining diastolic pressure with heart rate would tell us more about vascular tone. This is the thinking behind another increasingly popular index.
Diastolic shock index: when two numbers become one
The conventional shock index was introduced in 1967 as a way of identifying circulatory compromise, particularly in haemorrhage. It combines heart rate and systolic arterial pressure:
Shock index = HR / SBP
The reasoning is straightforward. When the circulation is compromised, heart rate may increase while systolic pressure falls. Dividing one by the other produces a number that increases as these changes become more pronounced.
Systolic pressure, however, reflects ventricular ejection and arterial properties as well as vascular tone. For identifying vasodilatation, diastolic pressure might be more useful.
As we have already established, diastolic pressure depends partly on the rate of arterial runoff and the time available for that runoff to occur. Reduced peripheral resistance accelerates runoff, tending to lower diastolic pressure.
Increasing heart rate, meanwhile, shortens diastole. Less time is available for runoff, tending to preserve diastolic pressure when other conditions remain unchanged.
Now consider a septic patient with a heart rate of 120 beats/min and a diastolic pressure of 40 mmHg.
Despite the shortened diastolic interval, pressure has fallen to a very low level before the next ventricular ejection. Substantial vasodilatation is one possible explanation.
This is the physiological reasoning behind the diastolic shock index (DSI), which substitutes diastolic for systolic pressure:
DSI = HR / DBP
The aim is to capture the combination of tachycardia and diastolic hypotension that may accompany severe vasodilatory shock.
Does it work?
In 2020, Ospina-Tascón and colleagues examined DSI in 761 patients with septic shock across two cohorts.
Higher DSI values were associated with increased mortality, with prognostic discrimination comparable to that of lactate and SOFA scores. The association was clearer than those obtained from heart rate or diastolic pressure considered separately.
A subsequent 2024 study involving 1,267 patients presenting with sepsis found that DSI predicted progression to septic shock with modest discrimination (AUROC 0.717).
The investigators also examined conventional shock index. Its performance was virtually identical (AUROC 0.707), with no statistically significant difference between the two.
Replacing systolic with diastolic pressure had not meaningfully improved prediction in that population. But does prognostic discrimination tell us anything more specific about the circulation?
What does the ratio actually tell us?
Consider three patients.
One has a heart rate of 90 and a diastolic pressure of 30 mmHg. Another has a heart rate of 120 and a diastolic pressure of 40 mmHg. The third has a heart rate of 150 and a diastolic pressure of 50 mmHg.
All three have a DSI of 3.
Yet their haemodynamic states may be very different.
The first has profound diastolic hypotension with relatively modest tachycardia. The third has severe tachycardia but a substantially higher diastolic pressure.
The ratio makes them numerically equivalent without establishing equivalent degrees of vasodilatation, cardiac dysfunction or tissue hypoperfusion.
Interestingly, the original investigators found that patients with similar DSI values tended to have similar mortality risks, even when their heart rates and diastolic pressures differed.
That supports its prognostic use, but similar prognosis does not establish similar physiology.
Heart rate is influenced by sympathetic activity, temperature, pain, drugs, conduction abnormalities and numerous other factors. Diastolic pressure depends on arterial resistance and compliance, but also on the preceding ventricular ejection and the time available for runoff.
A high DSI can therefore arise through several different mechanisms. It does not directly measure vascular resistance, vascular tone or cardiac function.
This criticism is not new. In a 2020 correspondence entitled The diastolic shock index works… but, what is it?, Rafael Dalmau questioned the physiological interpretation of the ratio. Ospina-Tascón and colleagues defended its rationale while acknowledging that it was not a direct measurement of vascular tone.
A prognostic index need not represent a fundamental physical quantity; combining measurements can improve prediction without identifying a unique mechanism.
The original investigators showed that DSI was associated with mortality more clearly than either heart rate or diastolic pressure alone. They did not demonstrate that dividing the two was superior to a predictive model considering both measurements together.
The ratio contains no information that was absent from the original measurements. It may organise that information usefully, but whether this particular calculation improves on considering both variables together remains uncertain.
Does DSI change what we do?
One proposed application is identifying patients with severe vasodilatory shock who might benefit from earlier vasopressor treatment rather than further fluid administration.
The original study found an association between very early vasopressor administration and lower mortality among patients with particularly high DSI. However, this was an exploratory observational analysis, not a trial of DSI-guided treatment. The investigators themselves acknowledged that using DSI to direct treatment required further study.
A septic patient who is tachycardic with a very low DBP already gives us reason to suspect substantial vasodilatation. We can assess cardiac function and flow, examine tissue perfusion and evaluate the response to treatment. Calculating DSI may help predict risk, but it cannot establish whether vasodilatation is the dominant problem, quantify its severity or determine the balance between fluids and vasopressors.
There is no established evidence that DSI-guided treatment improves patient outcomes. Tachycardia with profound diastolic hypotension is a useful warning sign; the ratio does not tell us which intervention will help.
Back to the circulation
Pulse pressure and DSI contain useful physiological information, but neither tells us as much about the circulation as we might hope.
A narrow pulse pressure can increase our suspicion of a small stroke volume, particularly in a patient with relatively stiff arteries. A wide pulse pressure is harder to interpret because increased stroke volume, reduced arterial compliance and altered runoff can produce similar findings.
DSI approaches the circulation differently. Tachycardia accompanied by a very low diastolic pressure may suggest substantial vasodilatation, and the ratio is associated with prognosis in septic shock. But it does not establish the mechanism of circulatory failure or identify the appropriate treatment.
So how useful are these measurements?
I look at pulse pressure because it’s already there on the monitor. An unusually narrow PP might make me more suspicious of a small stroke volume. But I’ll still use echocardiography to assess cardiac function and flow, rather than rely on an inference from arterial pressure.
The question isn’t whether a measurement contains physiological information. It’s whether that information is sufficiently reliable, or adds enough to what we can establish elsewhere, to influence our assessment or treatment.
That is where these indices become less convincing. Neither PP nor DSI can tell us whether increasing cardiac filling will improve output, whether vasopressors are the appropriate intervention, or whether the resulting changes will improve tissue perfusion at an acceptable physiological cost.
We began with systolic and diastolic pressures. We calculated their difference, then divided heart rate by diastolic pressure to produce another index. We gained additional ways of describing the circulation, but little evidence that the calculations improve on what we could establish more directly.
There is another way to interrogate the arterial waveform. Rather than interpreting pressure in isolation, we can observe how it responds to a repeated physiological perturbation. This is the basis of pulse pressure variation and stroke volume variation. Unlike many of the indices examined so far, these can genuinely predict a particular cardiovascular response.
But predicting a response and knowing whether to act on it are two very different things. This will be the subject of Complicated Ways to Learn Very Little, Part 4.
The five-minute ‘No Time to Derive’ companion to part 3 will be published for paid subscribers on Tuesday.
References
Westerhof N, Lankhaar JW, Westerhof BE. The arterial Windkessel. Med Biol Eng Comput. 2009;47(2):131–141. doi: 10.1007/s11517-008-0359-2. Full text
Mynard JP, Kondiboyina A, Kowalski R, et al. Measurement, analysis and interpretation of pressure/flow waves in blood vessels. Front Physiol. 2020;11:1085. doi: 10.3389/fphys.2020.01085. Full text
Putowski Z, Teboul JL, Castro R, et al. Can we reliably use pulse pressure as a surrogate for stroke volume? Physiological background and potential clinical implications for shock resuscitation. Crit Care. 2025;29:249. doi: 10.1186/s13054-025-05490-9. Full text
Ospina-Tascón GA, Teboul JL, Hernandez G, et al. Diastolic shock index and clinical outcomes in patients with septic shock. Ann Intensive Care. 2020;10:41. doi: 10.1186/s13613-020-00658-8. Full text
Jeon Y, Kim S, Ahn S, et al. Predicting septic shock in patients with sepsis at emergency department triage using systolic and diastolic shock index. Am J Emerg Med. 2024;78:196–201. doi: 10.1016/j.ajem.2024.01.029. PubMed