


Afterload is usually taught as “the load the heart pumps against.”
It sounds straightforward until you ask what that load actually is.
Arterial pressure? Systemic vascular resistance? Aortic impedance? Effective arterial elastance? Ventricular wall stress?
All of these have been used to describe afterload. They are related, but they are not the same thing.
Consider two patients with a systolic arterial pressure of 150 mmHg. One has a normal-sized, vigorous left ventricle and is entirely comfortable. The other has a dilated failing ventricle, a low stroke volume and pulmonary oedema.
The pressure is the same. The mechanical problem facing the myocardium is not.
To understand why, we have to start one step earlier than afterload itself.
What is the ventricle actually doing?
The heart is an energy transducer.
Chemical energy derived from metabolism is converted into mechanical energy by the myocardium and transferred to the blood.
At the beginning of systole the ventricle contracts with both valves closed. Pressure rises during isovolumetric contraction, but no blood is ejected and no external stroke work is yet being performed.
Once left ventricular pressure exceeds aortic pressure, the aortic valve opens. Blood begins to move and the ventricle performs work on the circulation.
The usual description is that the ventricle now has to “push against” arterial pressure. In a mechanical sense, that is true. Pressure exerts force. The ventricle must generate enough pressure to open the aortic valve and, during ejection, must continue generating sufficient wall tension to displace blood into an already pressurised arterial system. Moving a volume of blood against that pressure requires work.
But pressure is only part of the story.
The arterial pressure faced by the ventricle represents mechanical energy already present within the arterial system. During ejection, the ventricle transfers additional energy into that system. Some is stored elastically as the arteries distend, some contributes to accelerating blood, and some is irreversibly dissipated as blood flows through vascular resistance.
That distinction helps explain why the heart has to keep supplying energy beat after beat.
Imagine an inflated balloon with a small hole in it.
The pressure inside the balloon creates a real load on the pump. To force more air into the balloon, the pump has to work against that existing pressure.
But if there were no hole, the pump would not need to keep running simply because the balloon was pressurised. Once inflated, the balloon could remain under tension with energy stored in its stretched wall.
Add a hole and the situation changes. Air continually escapes. If the balloon is to remain at the same pressure, the pump must keep replacing what is being lost.
The circulation has a similar energetic problem, with one crucial difference: blood is not escaping from the vascular system. Mechanical energy is.
As blood flows through vessels, viscous forces irreversibly dissipate mechanical energy, predominantly as heat. Resistance describes the pressure-flow relation associated with that dissipation. If flow is to continue, the energy being lost must continually be replaced.
The heart supplies it.
So two related things are happening during ventricular ejection.
The ventricle is ejecting into an arterial system that is already pressurised, and that pressure contributes directly to the mechanical load it must meet.
At the same time, flow through the vascular system continually dissipates mechanical energy, requiring ongoing cardiac energy transfer if the circulation is to maintain its pressure-flow state.
Pressure itself is not what consumes the energy. A vascular system can remain pressurised without flow. The continuous energetic cost appears when blood moves through a dissipative pathway.
For a simple resistive load:
pressure loss = flow × resistance
and the rate at which mechanical energy is dissipated is:
power loss = pressure loss × flow
So, for the same flow, greater resistance means greater energy dissipation and therefore a greater cardiac power requirement.
If the ventricle has sufficient reserve, it may meet that requirement. Ventricular work rises, arterial pressure may rise, and flow can remain relatively well preserved.
If it cannot, flow falls.
The eventual pressure and flow are not dictated by resistance alone. They emerge from the interaction between the ventricle and the vascular system.
This also explains why a larger pressure gradient need not mean greater flow. If resistance increases, the pressure gradient across the circulation may become larger while flow falls. The larger gradient reflects the greater loss of mechanical energy along the pathway; it is not an independent source forcing the blood through it.
The ventricle therefore does more than simply “push against pressure”. It transfers energy into a pressurised, flowing and elastic arterial system — overcoming the existing pressure load while continually replacing the energy dissipated during flow.
The arterial system is more than a resistor
Resistance is only one component of the load faced by the ventricle.
The arterial circulation is pulsatile and elastic. During systole, some of the energy transferred by the ventricle is stored as the arteries distend. During diastole, some of that stored elastic energy is released again. Energy is also required to accelerate blood, and pressure and flow waves travel through the arterial tree and are reflected back from peripheral sites.
The ventricle therefore ejects into a system characterised by resistance, compliance, inertial effects, characteristic impedance and wave reflection. The timing of these effects has implications. A reflected wave arriving during systole does not present the same ventricular burden as one returning later in diastole.
Resistance predominantly describes dissipative loading.
Compliance describes elastic storage.
Characteristic impedance describes aspects of the immediate pulsatile load encountered as blood is accelerated into the proximal arterial system.
Wave reflection alters the pressure and flow environment seen by the ventricle during ejection.
Together they contribute to arterial load.
The ventricle does not eject into an SVR. It ejects into a pulsatile elastic arterial tree.
Yet even arterial load is not the end of the story.
It is the external challenge presented to the ventricle. It does not tell us the mechanical load actually borne by the myocardium.
For that, we need the ventricle itself.
The hill, the bicycle and the rider
Imagine riding a bicycle uphill.
The hill is the external load. Make the hill steeper and the cyclist has to generate more power to maintain the same speed.
But the hill alone does not determine how difficult the climb feels.
It also depends on the rider. A powerful cyclist may climb a gradient comfortably that overwhelms someone weaker.
And it depends on the bicycle.
Put the same rider on the same hill with terrible gearing and the force required at the pedals changes dramatically even though the hill has not changed at all.
The cardiovascular equivalents are useful.
The hill is the arterial load.
The rider is the ventricle’s force- and power-generating capability.
The bicycle and gearing are the ventricle’s geometry and mechanical advantage.
The complete problem is the interaction between all three.
In the context of afterload, it exposes something more fundamental: the external arterial load and the internal myocardial load are not synonymous.
At the myocardial level, afterload is most rigorously represented by the wall stress developed during ventricular ejection. To keep the cycling analogy, this corresponds to the muscular force the rider has to generate at the pedals.
The arteries create the external challenge. The ventricle must generate sufficient pressure to eject into that load; transmural pressure and ventricular geometry determine how this is translated into myocardial wall stress.
Geometry changes the meaning of pressure
Arterial pressure is a real mechanical load, but the myocardium does not experience pressure simply as a number in mmHg. It experiences wall stress.
Pressure inside the ventricle pushes outward on the inner surface. The myocardium has to generate tension within the wall to contain that pressure and, during systole, to shorten the chamber and eject blood.
How much tension is required depends strongly on ventricular geometry.
A useful way to picture this is to think about curvature.
Wall tension acts mainly along the myocardium. Because the ventricular wall is curved, part of that tension acts inward and helps oppose the pressure pushing the wall outward. A tightly curved wall does this efficiently.
As the ventricle dilates, the wall becomes less tightly curved. The same amount of tension now produces less inward restraining force. More tension is therefore required to contain the same intracavitary pressure.
A hammock gives the same intuition. If a weight is supported by a rope hanging in a deep curve, the tension in the rope has a substantial upward component. Pull the rope almost flat and the geometry becomes much less favourable: enormous tension is required to support the same weight.
Nothing about the weight has changed. The geometry through which the tension acts has.
A dilated ventricle has the same mechanical disadvantage. Its wall is less curved, so more myocardial tension is required to generate and contain the same ventricular pressure.
Wall thickness changes the problem again. A thicker ventricular wall provides more myocardial tissue across which that tension can be distributed. The stress carried by each unit of myocardium is therefore lower.
These relationships are captured approximately by Laplace:
wall stress ∝ transmural pressure × chamber radius / wall thickness
The real ventricle is thick-walled, three-dimensional and continuously changing shape, so this is not an exact equation for ventricular mechanics. The underlying relationships are robust:
higher transmural pressure increases wall stress;
a larger chamber radius increases wall stress;
greater wall thickness reduces wall stress.
Consider two ventricles generating exactly the same systolic pressure.
One has a relatively small cavity and a thick wall.
The other is dilated and relatively thin-walled.
The arterial pressure may be identical, but the dilated ventricle must develop much greater myocardial wall stress to generate it.
120 mmHg is not the same myocardial load for every ventricle.
This is the “gearing” in the cycling analogy. The external hill may be unchanged, but the mechanical advantage with which the muscle meets that load has deteriorated.
Ventricular dilatation can therefore become part of the mechanics of failure rather than merely a marker of it.
Poor ejection increases end-systolic volume. Radius increases. Greater wall stress is then required to generate the same pressure. The force and energy requirements of subsequent contraction rise, making ejection still harder.
The gearing has become worse.
The wall sees the pressure across it
There is one more part of the wall-stress equation that deserves careful attention.
The pressure that distends the ventricle is not simply the pressure inside it.
Pressure also acts on the outside of the ventricular wall.
Intracavitary pressure pushes outward. Pressure surrounding the heart pushes inward.
The myocardium therefore has to contain the difference between them:
transmural pressure = intracavitary pressure − surrounding pressure
Suppose LV systolic pressure is 120 mmHg and surrounding pressure is close to zero.
The ventricular wall is exposed to approximately 120 mmHg of net outward distending pressure.
Now suppose intrathoracic and pericardial pressure rise to +20 mmHg while LV systolic pressure remains 120 mmHg.
The pressure inside is still pushing outward with 120 mmHg.
But the outside is now pushing inward with 20 mmHg.
The net distending pressure across the wall is only:
120 − 20 = 100 mmHg
The external pressure is supplying some of the inward force required to oppose the pressure inside the chamber. The myocardium therefore needs less wall tension to contain the same intracavitary pressure.
It is not that external pressure is somehow making the myocytes contract or supplying contractile energy. It is mechanically unloading the wall by reducing the net pressure trying to distend it.
This is why positive intrathoracic pressure can reduce left ventricular afterload.
If intrathoracic pressure rises, LV transmural systolic pressure falls. For the same ventricular geometry, lower transmural pressure means lower wall stress.
Positive pressure ventilation simultaneously changes venous return, right ventricular loading, pulmonary vascular behaviour and ventricular interaction, so “PEEP reduces afterload” should not be interpreted as a statement that positive pressure is globally beneficial to the circulation. It is specifically a statement about LV transmural loading.
Wall stress also changes continuously during systole. Pressure changes, the ventricular radius decreases as blood is ejected, and the wall thickens as the myocardium contracts. There is therefore no single fixed myocardial afterload throughout the beat.
That is another reason arterial pressure alone is an incomplete description.
At the arterial level we can talk about the load presented to the ventricle. At the myocardial level, the mechanically relevant quantity is the stress within the ventricular wall required to meet that load.
And that stress depends not just on the pressure in the artery, but on the pressure across the ventricular wall and the geometry of the ventricle carrying it.
Why SVR is not afterload
Systemic vascular resistance is often used almost interchangeably with afterload.
It should not be.
SVR is usually calculated as:
SVR = (MAP − RAP) / cardiac output
It is a pressure–flow ratio derived from the haemodynamic state that has already emerged. It is not ventricular wall stress, does not describe ventricular geometry, and does not capture arterial compliance, characteristic impedance or wave reflection. Nor is it a direct measurement of vascular tone.
Suppose cardiac output falls from 5 to 2.5 L/min while MAP falls from 100 to 80 mmHg. Ignoring RAP for simplicity, calculated SVR rises from 20 to 32 — an increase of 60%.
The circulation now has a “high SVR”, even though the calculation alone cannot tell us that vasoconstriction caused the fall in flow. The value has risen partly because flow fell more than pressure did.
This is the same causal trap that appears throughout haemodynamics. Rearranging:
ΔP = flow × resistance
into:
resistance = ΔP / flow
does not turn the calculated resistance into an independently measured cause of the pressure and flow used to calculate it.
Arterial resistance remains a real component of arterial load because resistance dissipates mechanical energy during flow.
But:
resistance contributes to arterial load
is not the same statement as:
SVR is afterload.
Calling SVR “afterload” substitutes a calculated whole-circulation pressure–flow relation for the mechanical burden experienced by the ventricle.
Effective arterial elastance: compressing the arterial system into one number
The full arterial load is difficult to describe at the bedside.
Effective arterial elastance, Ea, is a lumped descriptor of that load and is commonly approximated as:
Ea ≈ end-systolic pressure / stroke volume
The balloon analogy helps here too.
Imagine pumping a fixed amount of air into an elastic balloon that has a leak.
The pressure reached by the end of the inflation depends on several things at once.
A stiff balloon develops a larger pressure rise for the same added volume.
A tighter leak allows less air to escape during inflation, so pressure remains higher.
If you inflate the balloon more quickly, or start the next inflation before much pressure has fallen, the final pressure will also be higher.
Measure only:
final pressure / volume pumped in
and you do not know which of those mechanisms produced the result.
You have compressed their combined effect into a single number.
Ea does something similar for the arterial circulation.
For a given stroke volume, the end-systolic pressure reached depends on the properties and timing of the arterial system into which that volume was ejected. Arterial compliance affects how much pressure rises as volume enters the arteries. Peripheral resistance affects how much blood runs off from the arterial compartment during systole. Heart rate and systolic timing affect how much pressure and stored elastic energy remain from one beat to the next.
Their combined effects are therefore reflected in the relationship between end-systolic pressure and stroke volume.
A higher Ea means that, in the resolved state, a greater end-systolic pressure was associated with each unit of stroke volume ejected.
That does not mean Ea directly measures resistance, compliance or any other single arterial property. Nor does it fully describe the pulsatile arterial load. Characteristic impedance, wave reflections and the detailed pressure-flow waveform can differ substantially between arterial systems with similar Ea.
The word elastance can also be misleading. Ea has the units of an elastance — pressure divided by volume — but it is not simply the physical stiffness of the arterial tree. It is an effective, reduced-order representation of the arterial load as seen by the ventricle.
Its real value appears when it is compared with the ventricular side of the system.
Ea summarises the external arterial load.
Ees summarises ventricular end-systolic contractile properties.
Their relationship gives a compact description of how well the ventricle is matched to the load it is ejecting into.
Which brings us back to the cyclist.
A steeper hill does not necessarily make the cyclist slow down
Another common simplification is:
afterload increases → stroke volume falls
That is not a general law.
Increase the gradient of a hill and a strong cyclist may simply produce more force and power while maintaining the same speed.
A ventricle with sufficient reserve can do the same.
Increase arterial load and the ventricle can generate greater pressure, perform more stroke work and maintain stroke volume.
The cost is higher myocardial work and greater energy expenditure.
A fall in stroke volume occurs when the ventricle cannot adequately meet the increased mechanical demand.
Then ejection becomes less complete. End-systolic volume rises. Stroke volume falls. Residual ventricular volume feeds into the next filling cycle, and filling pressure may rise.
The same arterial load can therefore produce radically different haemodynamic states depending on the ventricle facing it.
This is the essence of ventriculo-arterial coupling.
A useful reduced-order representation compares effective arterial elastance, Ea, with ventricular end-systolic elastance, Ees. Ees describes the force-generating properties of the ventricle at end systole and is commonly used as a relatively load-independent index of contractile state. Their relationship describes how well ventricular capability is matched to arterial load.
The mathematics is less important here than the idea.
There is no clinically meaningful account of a hill without considering the cyclist climbing it.
A high arterial load can coexist with excellent cardiac output when ventricular reserve is substantial.
A much lower arterial load can overwhelm a weak, dilated or mechanically disadvantaged ventricle.
The pathological state is often better described as afterload mismatch than simply “high afterload”: the load is excessive relative to the capacity of that ventricle to meet it.
Why reducing arterial pressure can increase cardiac output
Once afterload is viewed this way, several apparently paradoxical clinical observations become straightforward.
A patient with severe LV systolic dysfunction may be maintaining a high end-systolic volume because the ventricle cannot adequately eject against the arterial load it faces.
Reduce that load and the same ventricle can eject further.
End-systolic volume falls.
Stroke volume rises.
Cardiac output may rise.
Upstream filling pressure can fall.
And arterial pressure may fall at the same time.
So:
MAP ↓
stroke volume ↑
cardiac output ↑
is entirely possible.
There is no contradiction. Pressure and flow are different dependent features of the circulation.
This is why arterial vasodilatation can produce a striking improvement in a patient with load-sensitive LV failure. Reducing the external load allows more of the ventricular mechanical energy to appear as forward stroke work rather than being consumed in generating high wall stress and pressure with poor ejection.
Acute pulmonary oedema makes the interaction particularly visible.
A struggling LV does not empty adequately. End-systolic volume rises. The larger ventricular radius worsens the mechanical disadvantage. Filling pressure rises and that pressure is transmitted backwards into the left atrium and pulmonary circulation.
Arterial vasodilatation reduces the external load.
Positive airway pressure can reduce LV transmural systolic load.
The ventricle may suddenly empty more effectively without any improvement in its intrinsic contractility.
The hill has become easier.
The rider has not become stronger.
Vasopressors act on both sides of the circulation
The same framework prevents another oversimplification: that vasopressors simply “increase afterload”.
A drug such as norepinephrine changes several parts of the coupled circulation at once.
Venoconstriction alters the systemic vascular pressure-volume state and can increase the delivery of filling to the heart.
Arteriolar constriction alters the arterial side and can increase resistive load.
The net effect depends on the operating state of the circulation and on ventricular reserve.
If systemic delivery is inadequate and the ventricle has plenty of power reserve, increasing vascular tone can increase filling and cardiac output despite an increase in arterial load.
If the ventricle is severely impaired and already struggling to eject, additional arterial loading may instead constrain stroke volume.
Neither “norepinephrine increases afterload” nor “norepinephrine improves venous return” is enough to describe the haemodynamics.
It changes the vascular system presented to both sides of the heart. The resulting pressure and flow depend on how the heart responds.
The right ventricle exposes the same problem
The same mistake is made when pulmonary vascular resistance is treated as synonymous with right ventricular afterload.
PVR is an important component of pulmonary vascular load. It is not the whole load.
The right ventricle ejects into a highly compliant, pulsatile pulmonary circulation. Its burden depends not only on pulmonary vascular resistance but also on pulmonary arterial compliance, characteristic impedance, pressure, wave reflection, lung volume and intrathoracic pressure.
The RV is also exquisitely sensitive to geometry.
As it dilates, wall stress rises. Septal position changes. Ventricular interaction becomes increasingly important. A load that a normal RV handles easily may become overwhelming once RV–pulmonary arterial coupling deteriorates.
PVR is no more synonymous with RV afterload than SVR is with LV afterload.
The relevant question is again whether the ventricle is matched to the vascular load it faces.
So what is afterload?
Several different levels have accumulated under one word.
At the arterial level, there is arterial load: the external mechanical burden presented by the vascular system during ejection. Pressure, resistance, compliance, impedance, wave reflection and timing all contribute to it.
At the myocardial level, afterload is most rigorously represented by the wall stress borne during ventricular ejection.
Arterial pressure influences that wall stress.
So does ventricular radius. So does wall thickness. So does surrounding pressure.
And the effect of that wall stress on stroke volume depends on the force- and power-generating capability of the ventricle.
These relationships can be arranged as a simple hierarchy:
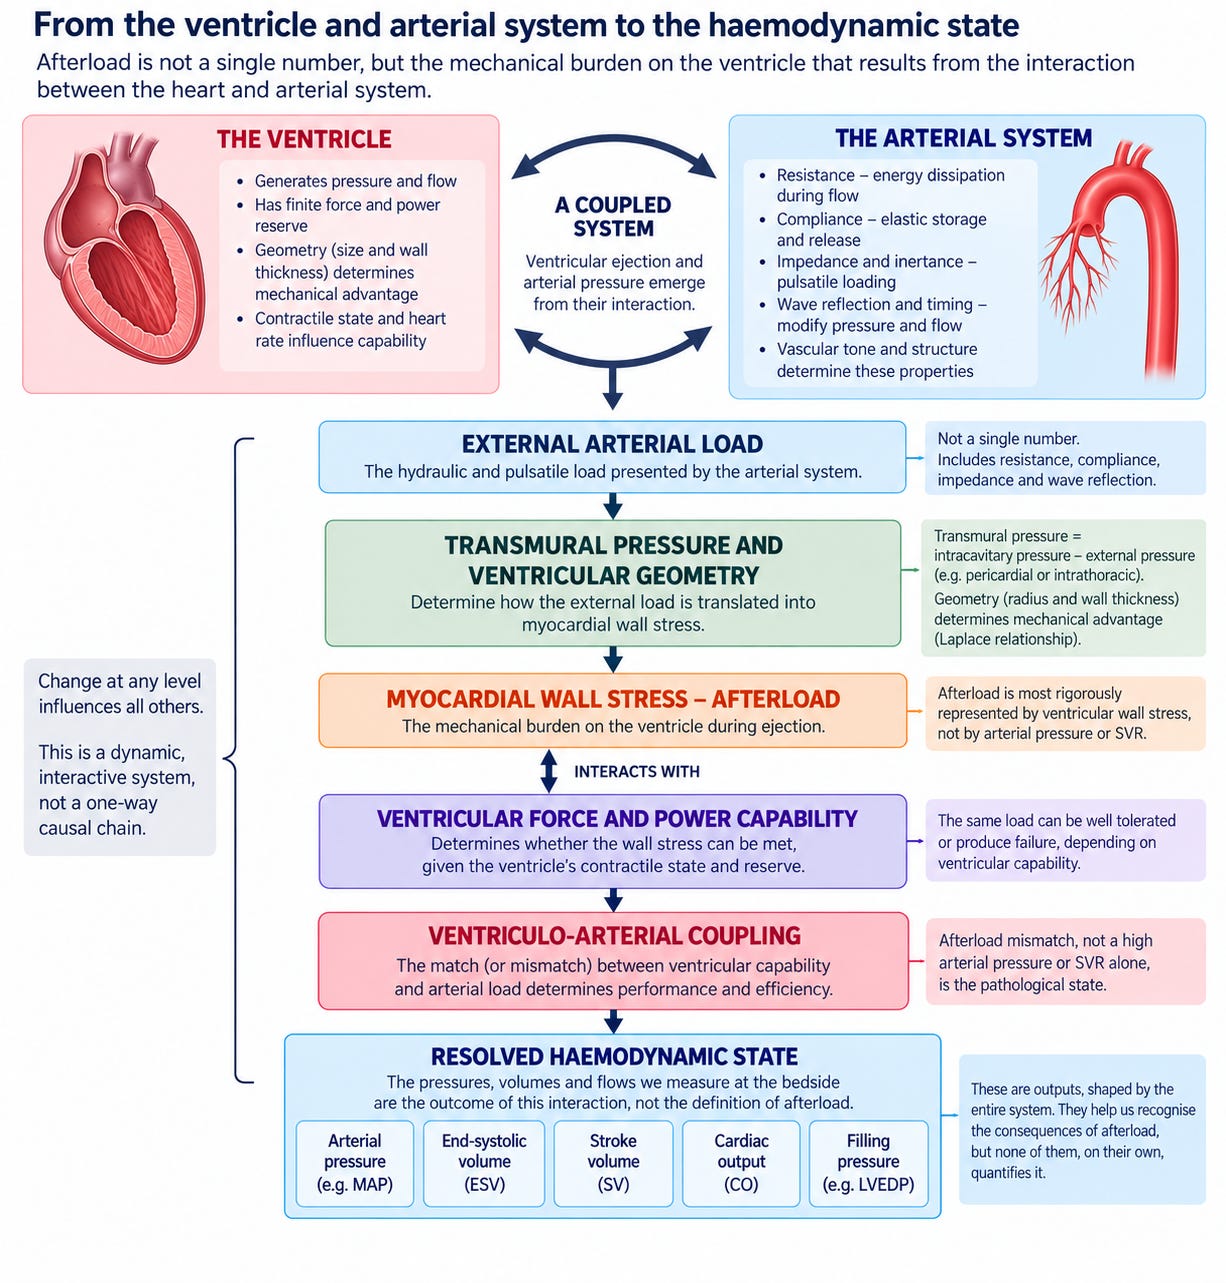
The arterial system presents an external load; transmural pressure and ventricular geometry determine how that load is translated into myocardial wall stress; ventricular capability determines whether it can be met. The pressures, volumes and flows we measure at the bedside appear at the end of that interaction, not at the beginning.
That hierarchy also changes the bedside question.
Instead of asking whether “afterload is high”, ask what arterial load the ventricle is facing, how that load is being translated into myocardial stress, and whether the ventricle has enough reserve to meet it.
Look at the arterial pressure, but do not mistake it for the whole load.
Use SVR or PVR if they are helpful descriptions of the current pressure-flow relation, but do not turn them into physical objects resisting ventricular ejection.
Consider ventricular size and wall thickness.
Consider transmural pressure when intrathoracic or pericardial pressure is abnormal.
And watch what happens when the load changes.
Does stroke volume increase?
Does the ventricle empty further?
Do filling pressures fall?
Does congestion improve?
The response often tells us more about the mechanical problem than a calculated resistance ever could.
The heart does not simply push against pressure. It continually transfers energy into a vascular system that stores some of that energy, returns some of it and dissipates some of it. The arterial circulation sets the external challenge. Ventricular geometry determines how that challenge is translated into myocardial stress. Ventricular capability determines whether the load can be met.
The balloon explains why the pump must keep working.
The hill describes the external challenge.
The bicycle determines the mechanical advantage.
The rider determines whether the climb can be sustained.
Afterload is not the hill. It is the mechanical burden of climbing it.
References
Caicedo Ruiz JD, Aldana JL, Kattan E, et al. Left ventricular–arterial coupling in septic shock: a physiological review. J Crit Care. 2026;93:155486. doi: 10.1016/j.jcrc.2026.155486. PubMed
Chirinos JA. Ventricular–arterial coupling: invasive and non-invasive assessment. Artery Res. 2013;7(1):2–14. doi: 10.1016/j.artres.2012.12.002. Springer
Milnor WR. Arterial impedance as ventricular afterload. Circ Res. 1975;36(5):565–570. doi: 10.1161/01.RES.36.5.565. PubMed
Corp A, Thomas C, Adlam M. The cardiovascular effects of positive pressure ventilation. BJA Educ. 2021;21(6):202–209. doi: 10.1016/j.bjae.2021.01.002. PubMed Central (PMC)