


Someone hands you a blood gas. The standard base excess is −8.
What caused it?
Part 1 took us through H⁺, buffers and the first reading of a blood gas. Part 2 went deeper into the chemistry and explored how the composition of plasma changes its acid–base state.
But −8 does not tell us what happened to this patient.
Perhaps chloride is high relative to sodium. Perhaps lactate has accumulated. Perhaps several acidifying effects are being partly concealed by an alkalinising one. The net result can contain very different contributions.
This is where the chemistry from Parts 1 and 2 becomes clinically useful.
We still begin with the pH, PCO₂ and SBE together. SBE describes the metabolic component, PCO₂ the respiratory component, and pH their combined result. We assess ventilation in the clinical context. The calculations that follow investigate the metabolic component; they do not tell us whether ventilation is appropriate. As we saw in Part 1, part of that metabolic component may itself be renal compensation for a sustained respiratory disturbance.
Many blood-gas analysers give us sodium, chloride, potassium and lactate on the same report. For the calculations below, we also need albumin. If your analyser does not provide the electrolytes or lactate, use measurements taken at approximately the same time. Combining results taken before and after an intervention that has changed the acid–base state can produce a misleading calculation.
Let us start with the traditional approach: the anion gap.
A gap in our counting
In Part 2, we established that plasma remains essentially electrically neutral. Positive and negative charges balance. So how can it have an anion gap?
Because we do not count everything. The usual calculation is:
Anion gap = Na − Cl − HCO₃
We count sodium on the positive side, then chloride and bicarbonate on the negative side. For example:
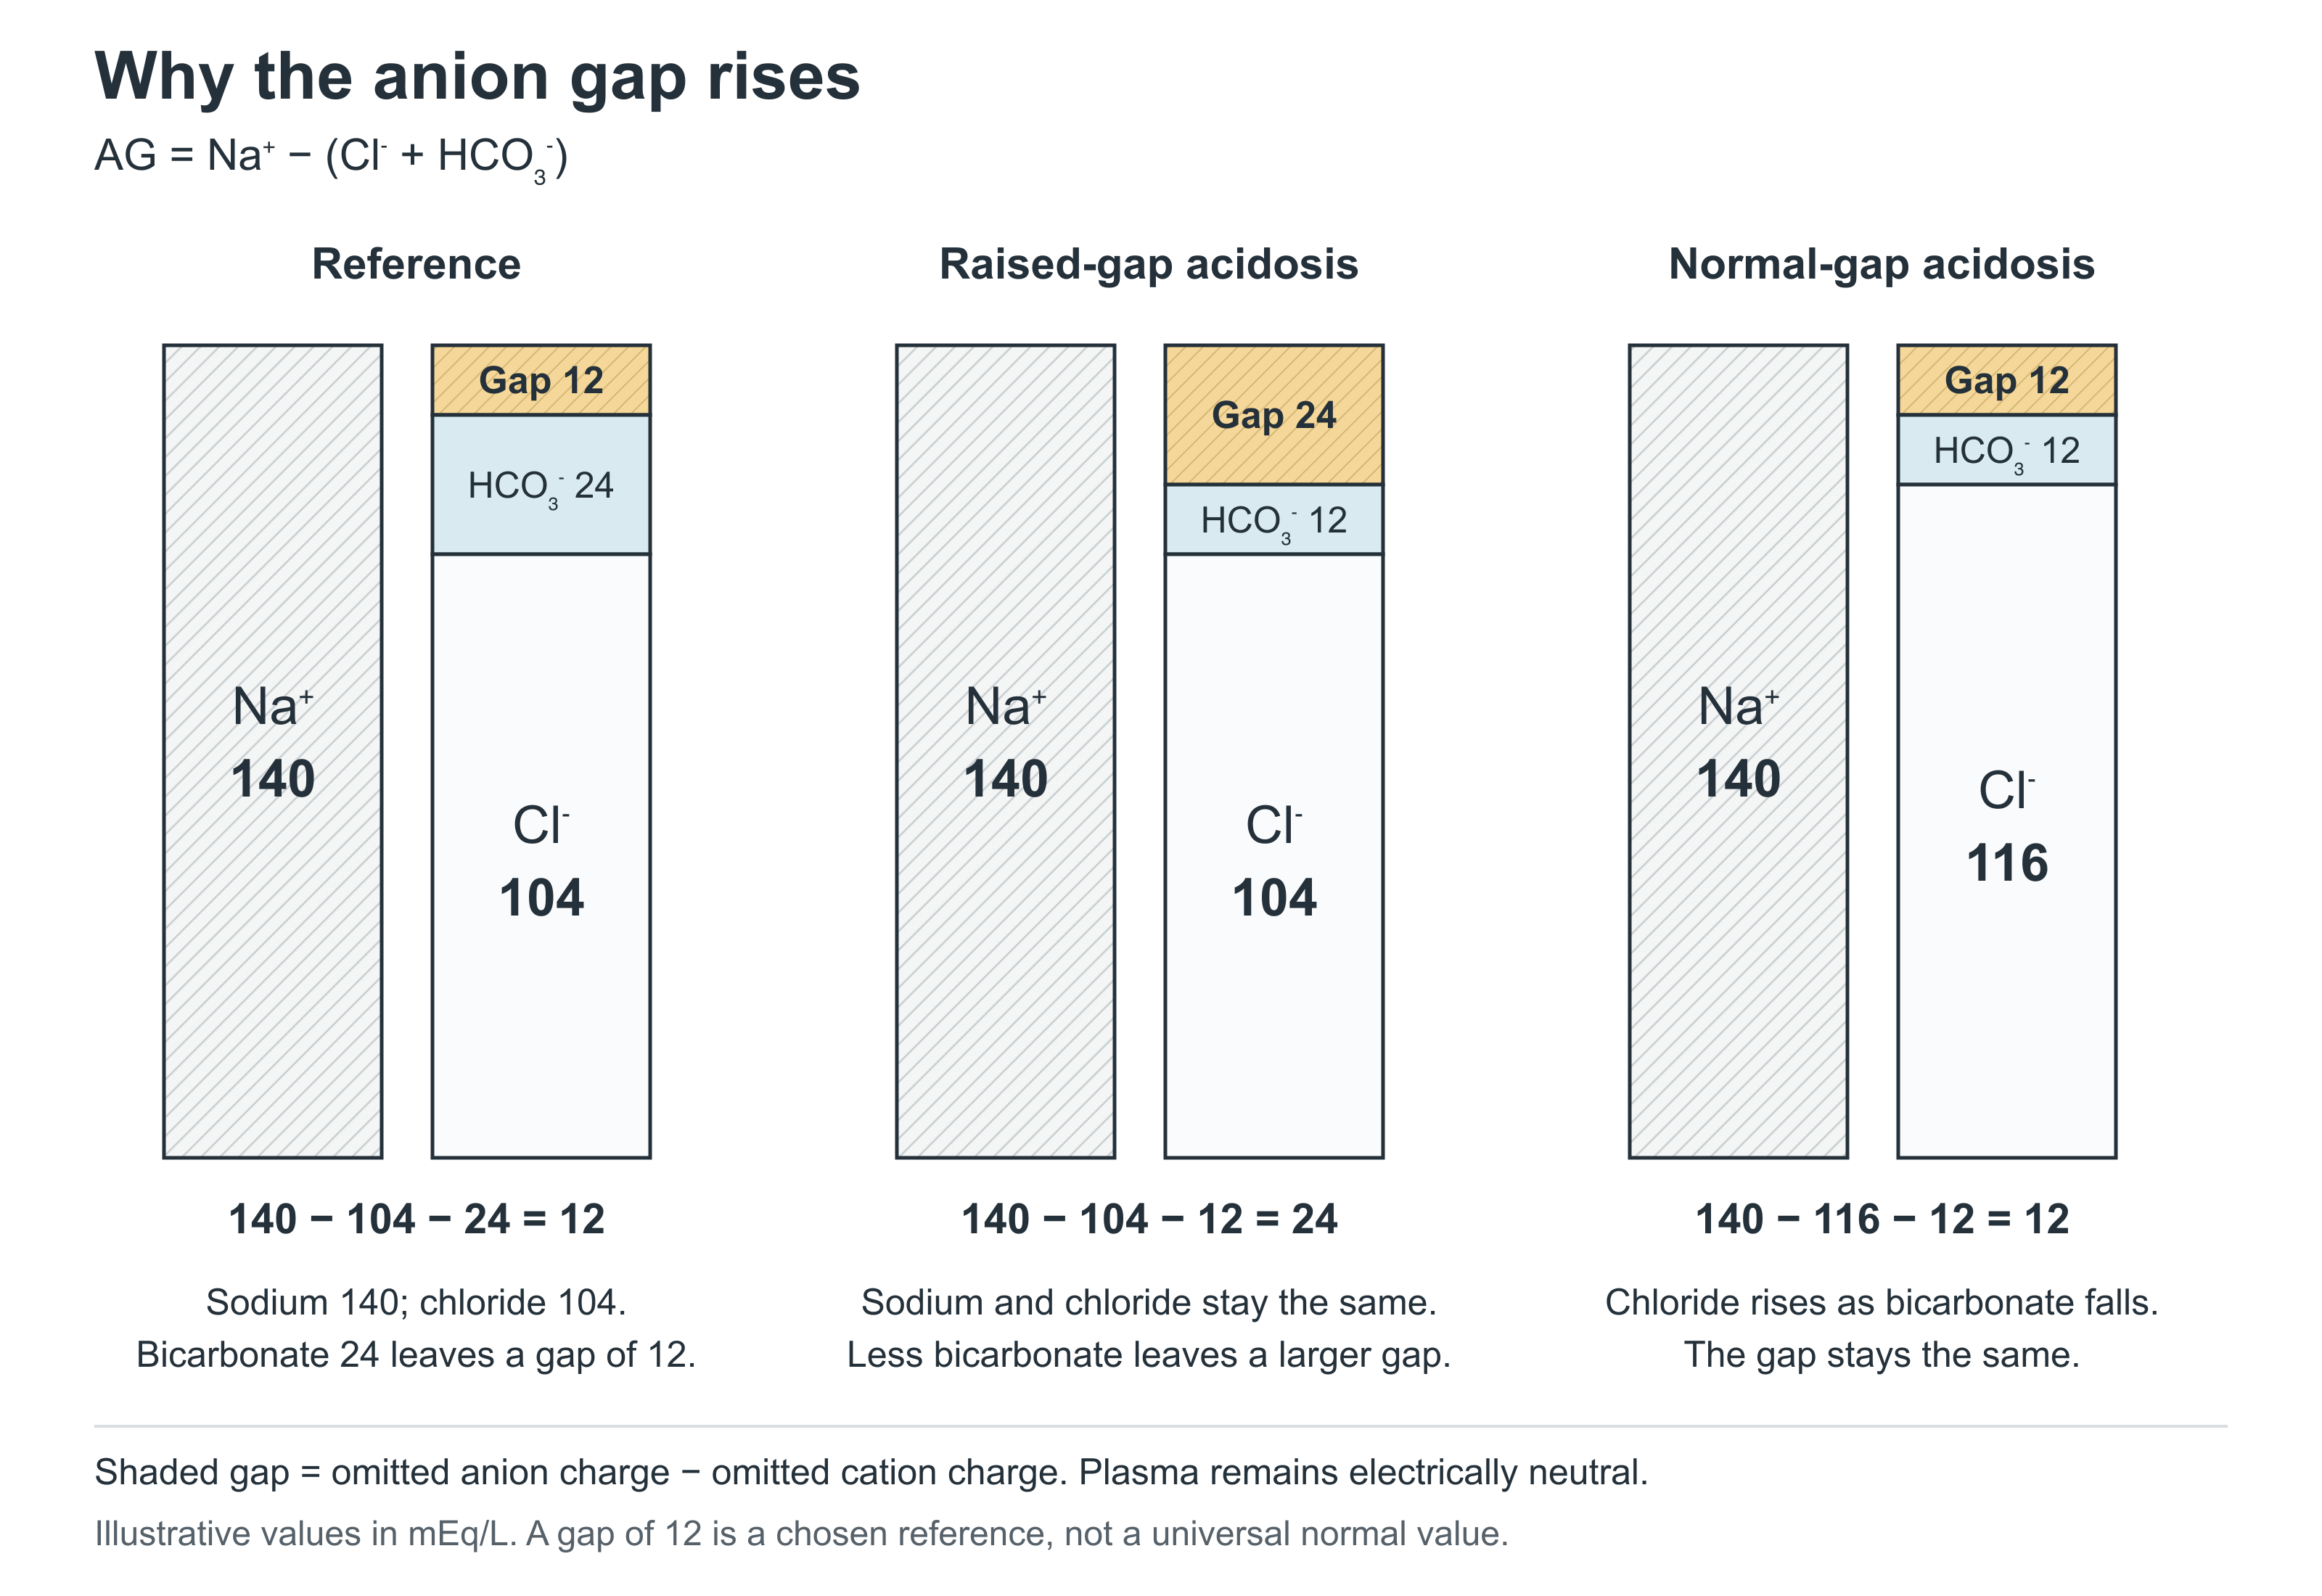
140 − 104 − 24 = 12 mmol/L
Those ions each carry one charge, so the numerical result is also 12 mEq/L.
The missing negative charge is carried largely by albumin, with contributions from phosphate and other anions. We have also omitted positive ions, including potassium, calcium and magnesium. The gap is therefore the difference between the negative and positive charges left out of our calculation. It is a gap in the list, not an electrical imbalance in the blood.
The connection with Part 2 is obvious:
AG = (Na−Cl) − bicarbonate
Na−Cl approximates part of the strong-ion difference. Subtracting bicarbonate leaves us looking at the balance of the other charges.
Now suppose ketoacids accumulate. They release H⁺, much of which is taken up by buffers. Bicarbonate falls, while the accompanying ketoanions remain in the solution. With sodium and chloride unchanged, subtracting a smaller bicarbonate concentration leaves a larger gap.
Compare that with a patient whose bicarbonate falls while chloride rises relative to sodium. The sum of chloride and bicarbonate may change very little, so the gap remains near its usual value. We can see this pattern after gastrointestinal bicarbonate loss or chloride-rich fluid administration, although the physiological events are different.
These are the origins of the terms raised-anion-gap and normal-anion-gap metabolic acidosis. Both patterns can occur in the same patient.
The reference interval comes from the laboratory. Twelve is a useful illustrative value, not a universal definition of normal. Analytical methods differ, and some laboratories include potassium in the calculation. If potassium is included, the reference gap must include its usual contribution too.
There is one vitally important adjustment: albumin.
Albumin can hide the rise
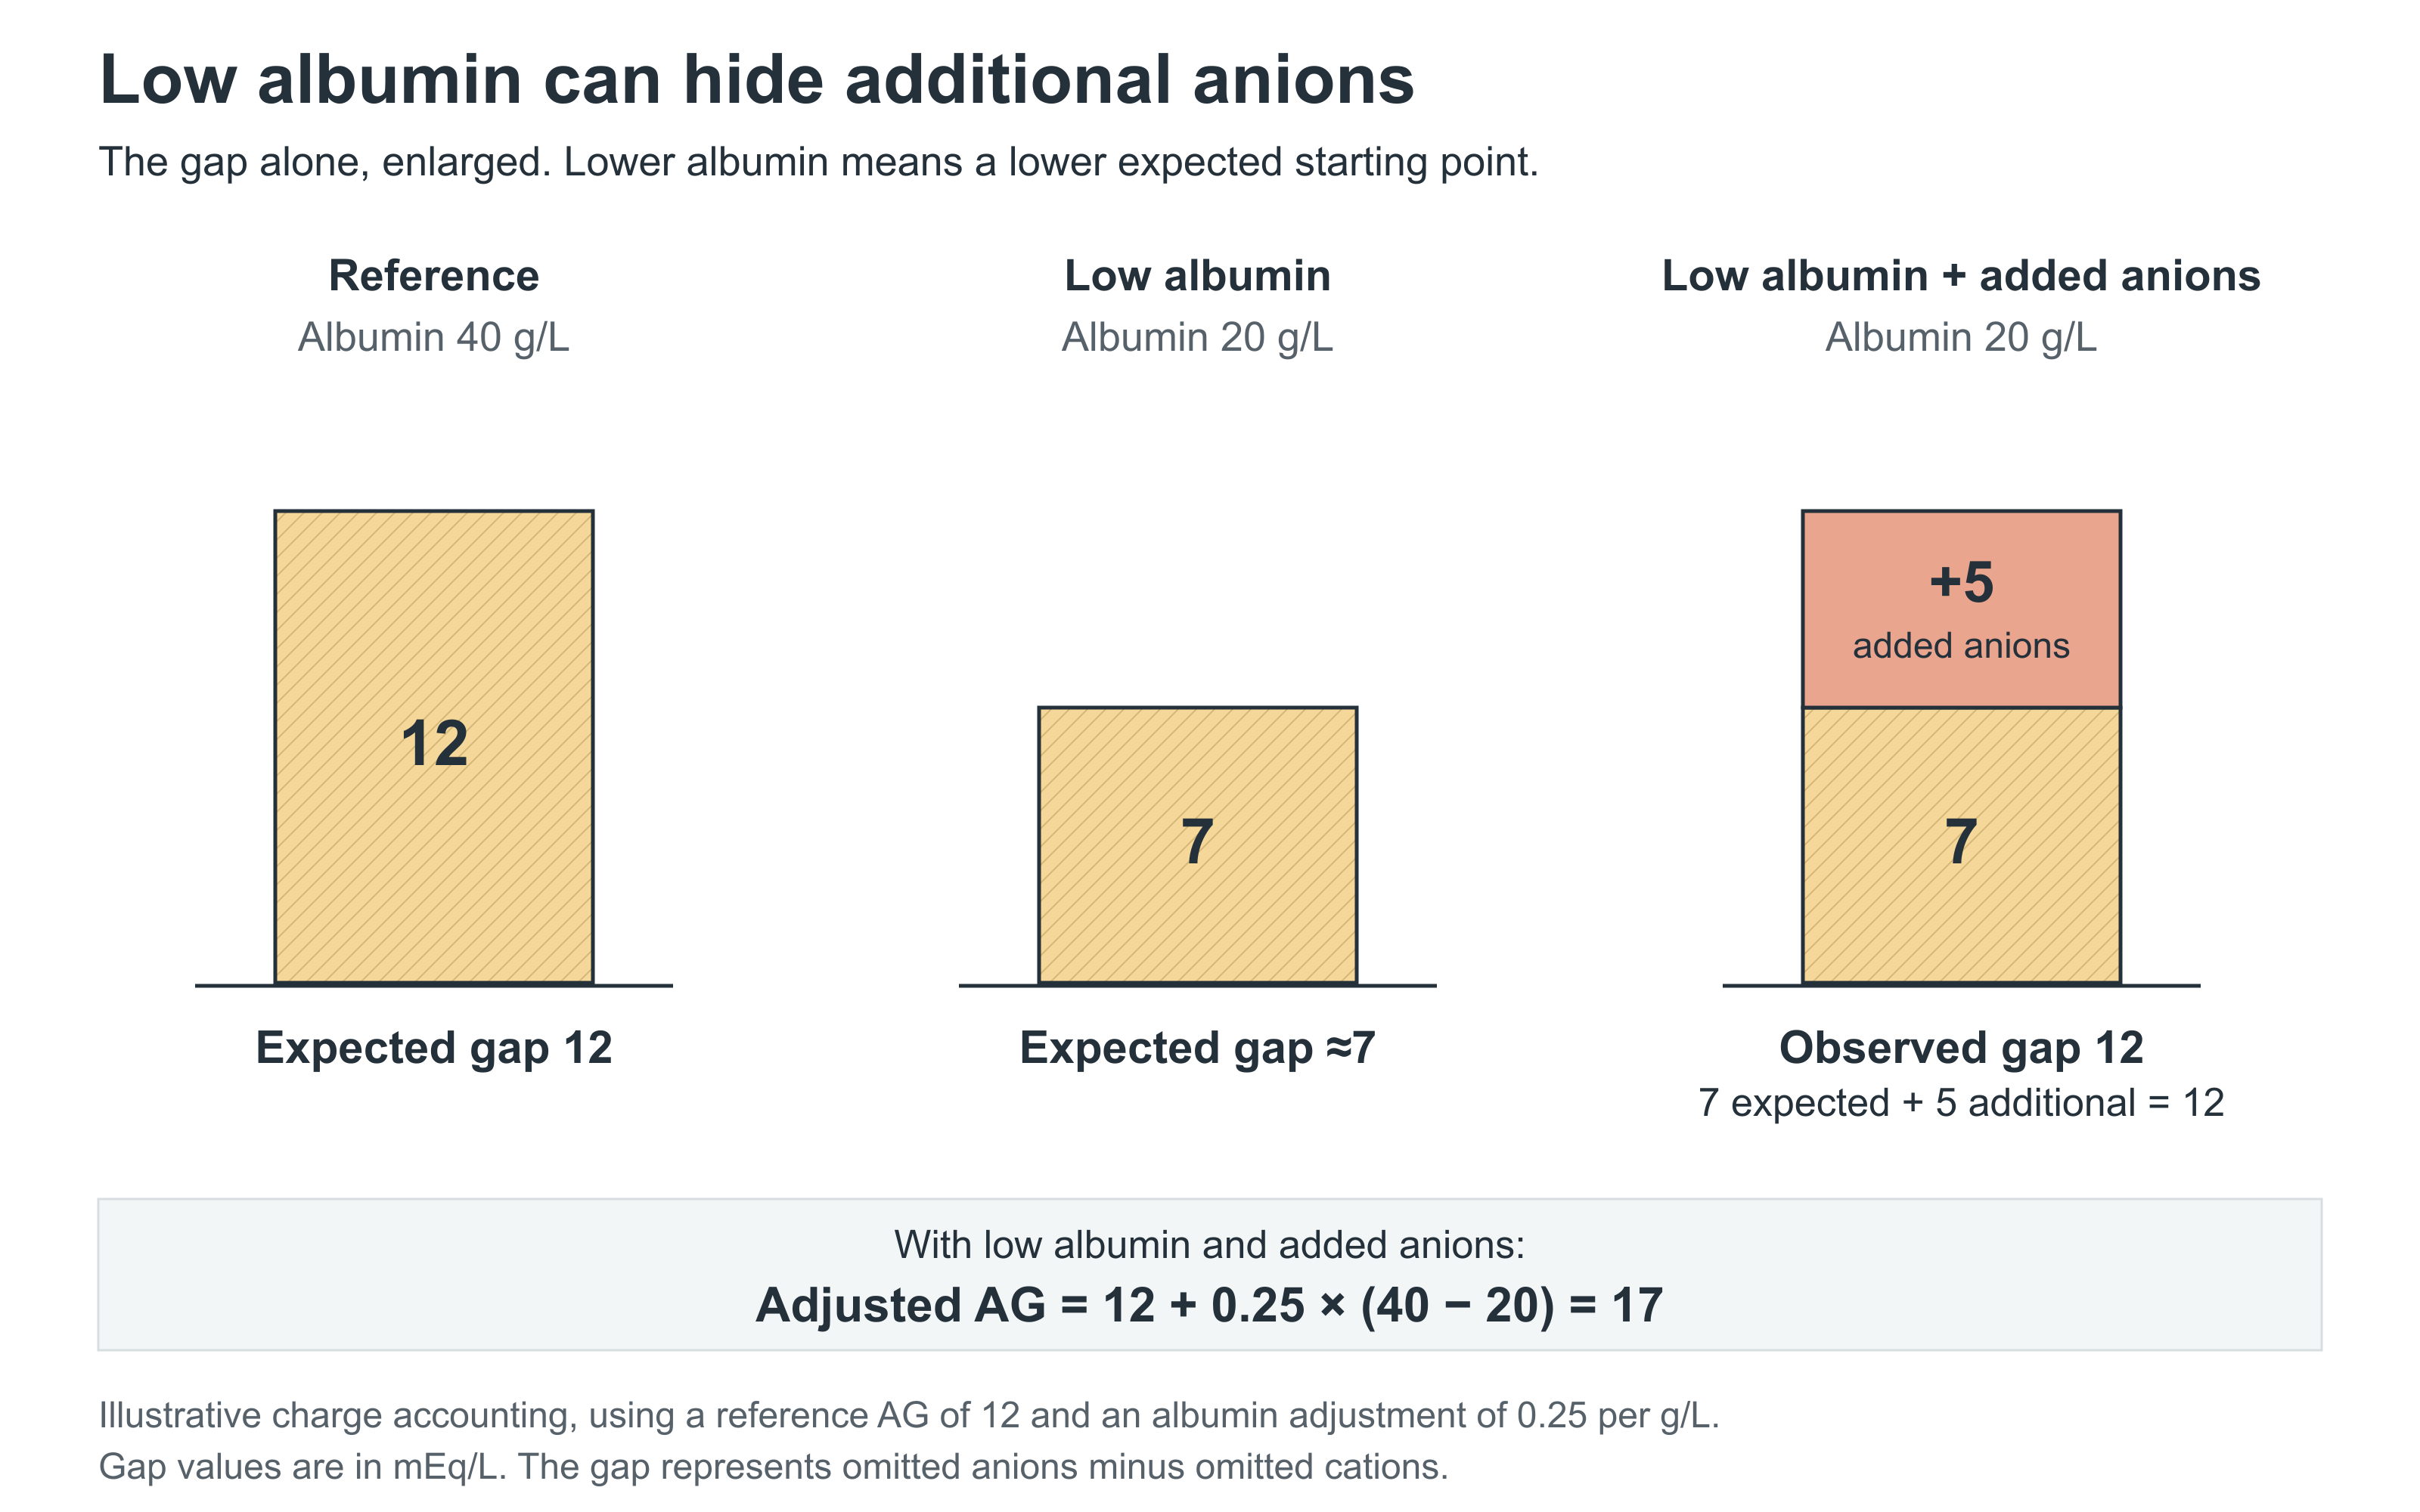
Albumin carries much of the negative charge omitted from the anion-gap calculation. If there is less albumin, the expected gap is smaller.
Imagine a patient whose albumin has fallen substantially. Additional anions could raise that patient’s gap from a low starting point into the laboratory’s normal range. The report may look reassuring even though something has accumulated.
We can estimate an albumin-adjusted gap using:
Adjusted AG = measured AG + 0.25 × (40 − albumin in g/L)
For readers using g/dL:
Adjusted AG = measured AG + 2.5 × (4.0 − albumin in g/dL)
At an albumin of 20 g/L, or 2.0 g/dL, we add approximately 5 to the observed gap. This adjustment asks what the gap might look like if albumin were closer to the reference concentration. Figge and colleagues quantified this relationship.
Low albumin also has the alkalinising contribution we explored in Part 2. These are two consequences of the same change: it can conceal additional anions in the gap and partly oppose their acidifying contribution to the metabolic result.
An adjusted gap still cannot identify the anions. Lactate is usually already on the blood-gas report, so we can use its measured concentration to account for part of the gap. Further tests, such as blood ketones, depend on the clinical circumstances.
Each lactate ion carries one negative charge: 5 mmol/L is 5 mEq/L of charge contributing to the gap, all else equal. For a rough bedside estimate, simply subtract the measured lactate from the albumin-adjusted gap. If what remains is still above the usual reference, other anions may be contributing.
The anion gap can therefore do quantitative accounting. It does more than tell you that something is wrong. What could those anions be?
I use KUSMAL to organise the possibilities:
K — Ketones. The main anions are β-hydroxybutyrate and acetoacetate. Think of diabetic ketoacidosis, but also alcohol-associated and starvation ketoacidosis.
U — Uraemia. Reduced renal excretion allows sulphate, phosphate and organic anions such as hippurate and urate to accumulate.
S — Salicylates. These can produce metabolic acidosis together with respiratory alkalosis: another reason to resist reassurance from a nearly normal pH.
M — Methanol. Its metabolism produces formate, which contributes to the acidosis.
A — Antifreeze. Here I mean ethylene glycol, whose metabolism produces acidic substances including glycolate.
L — Lactate. Its concentration reflects both production and removal. A raised result does not, by itself, establish tissue hypoxia.
Most of these behave as strong anions at physiological pH. Phosphate, included under uraemia, is a weak-acid buffer: its charge changes as it binds or releases H⁺. Both strong anions and weak-acid charges can contribute to the gap.
“Unmeasured anions” means anions omitted from the gap calculation. Lactate remains outside the standard formula even when the analyser has printed its concentration on the result sheet.
KUSMAL is useful, but it has omissions.
Pyroglutamate, also called 5-oxoproline, can accumulate in patients taking regular paracetamol, sometimes alongside flucloxacillin. Malnutrition, infection and renal dysfunction are common accompanying features. This can occur at therapeutic paracetamol doses; an overdose is not required. Reported cases illustrate how easily it can be overlooked.
D-lactate technically fits under L, but routine lactate measurements usually detect only L-lactate. These are mirror-image forms of the molecule. Short bowel is the classic setting for D-lactic acidosis: unabsorbed carbohydrate reaches gut bacteria, which ferment it and produce D-lactate. Confusion, slurred speech and ataxia can accompany the acidosis. It requires a specific test. It is not exclusive to short bowel, nor is it the “anaerobic version” of lactate; our usual lactate production generates the L form, with or without adequate oxygen.
Propylene glycol is different from ethylene glycol. It is used as a solvent in some intravenous medicines, including some lorazepam preparations. Substantial exposure can allow it to accumulate and contribute to acidosis. ICU studies have documented accumulation during continuous lorazepam administration.
The mnemonic gives us places to look. The history, drugs, renal function and direct measurements decide which are plausible.
An easier way to arrange the numbers
We can use the anion gap well. Account for albumin, measure likely contributors and investigate an unexplained excess. There is nothing chemically inferior about doing that. But I prefer another way of arranging the information.
Fencl and colleagues developed clinical applications of the physicochemical approach. Story and colleagues then simplified the calculations into estimates of contributions to base excess.
This is why I like BE. Its reference is zero. Acidifying contributions are negative; alkalinising contributions are positive. We can put them alongside each other and add them towards the result on the report.
Here, BE means the standard base excess, or SBE, discussed in Part 1. The contributions below are expressed in mmol/L of acid or base equivalents, numerically the same as mEq/L. They estimate the metabolic effect; BE is not a measurement of net electrical charge in plasma.
We will build the calculation one contribution at a time.
Sodium and chloride
Start by subtracting chloride from sodium. Then compare that difference with 38:
Estimated Na−Cl contribution = Na − Cl − 38
For sodium 140 and chloride 110 mmol/L:
140 − 110 = 30
Thirty is eight below the reference of 38, so the estimated contribution is −8. It is acidifying.
If sodium is still 140 but chloride is 100:
140 − 100 − 38 = +2
That gives a small alkalinising contribution.
We are looking at chloride relative to sodium. The chloride concentration on its own is less informative, particularly when sodium is abnormal.
The 38 belongs to this simplified formula. It is not a universal normal value for the full SID. Na−Cl leaves out other strong ions, so large changes in those ions, potassium being one example, will not be captured by it.
Albumin
Next estimate the albumin contribution:
Estimated albumin contribution = 0.25 × (42 − albumin in g/L)
Or, with albumin in g/dL:
2.5 × (4.2 − albumin)
At 22 g/L, or 2.2 g/dL:
0.25 × (42 − 22) = +5
The sign is positive because less albumin means less weak-acid material, an alkalinising contribution under the conditions explained in Part 2.
There is an easy bedside shortcut. Many ICU patients have albumin around 20–22 g/L, roughly half normal. At those concentrations the calculation gives +5 to +5.5. For a quick estimate:
Albumin roughly half normal? Allow about +5.
That is +5 in the sum of contributions. It is already reflected in the reported BE. If the BE is −8 despite an albumin contribution of +5, the other contributions must sum to approximately −13.
You may have noticed that the albumin reference here is 42 g/L, while the AG adjustment used 40. These are the conventions of the two formulas. Story has not abolished reference values; it builds them into calculations whose answers sit on the same BE scale.
What remains?
We have the reported SBE and two estimated contributions. Subtract those contributions to find the remainder:
Residual = SBE − Na−Cl contribution − albumin contribution
A negative residual suggests additional acidifying contributions, including anions we have not yet accounted for.
It is tempting to label that result “unmeasured acid”. I prefer residual. It includes whatever this simplified calculation leaves out, together with approximation and measurement error. It is not a laboratory measurement of an unidentified substance.
Lactate is still inside this residual. If we know its concentration, we can account for it separately:
SBE ≈ Na−Cl contribution + albumin contribution − lactate + remaining contribution
For this version we use the whole measured lactate concentration. A lactate of 3 mmol/L enters as approximately −3. We then recalculate the remainder; we must not retain the original residual and count lactate a second time.
As with AG, the reference convention has to stay consistent. Subtracting the whole lactate includes its small usual contribution as well as any increase. The remaining number therefore need not be exactly zero even in normal plasma. We are estimating the composition of a disturbance, not performing an exact chemical assay.
Let us put this together in one patient:
Consider this illustrative set of results:
- pH 7.31
- PCO₂ 4.7 kPa (35 mmHg)
- Bicarbonate 17 mmol/L
- SBE −8 mmol/L (−8 mEq/L)
- Sodium 140 mmol/L
- Chloride 110 mmol/L
- Albumin 22 g/L (2.2 g/dL)
The pH shows acidaemia
The CO₂ is lower than the normal reference value of 5.33 kPa (≈ 40 mmHg) so there is partial respiratory compensation
The negative BE, or low bicarbonate if you prefer, shows a metabolic acidosis
What is causing the metabolic component of the pH?
Anion gap method:
140 − 110 − 17 = 13
Depending on the laboratory, that might attract little attention. But albumin is low. Adjusting for it gives:
13 + 0.25 × (40 − 22) = 17.5
We compare that with the laboratory’s reference. The adjustment makes the possibility of additional anions more apparent.
Story’s method:
1. Calculate the Na−Cl contribution
Na − Cl − 38
140 − 110 − 38 = −8
So the estimated Na−Cl contribution is:
−8
2. Calculate the albumin contribution
0.25 × (42 − albumin in g/L)
With albumin 22 g/L:
0.25 × (42 − 22) = +5
So far, the two estimated contributions are:
−8 + 5 = −3
But the reported SBE is −8, so something else must be contributing in the acidifying direction.
3. Calculate the residual
Residual = SBE − Na−Cl contribution − albumin contribution
So:
−8 − (−8) − (+5) = −5
The estimated residual contribution is therefore:
−5
Put the three components back together:
−8 + 5 − 5 = −8
So the reported SBE of −8 can be partitioned approximately into:
Na−Cl: −8
Albumin: +5
Residual: −5
This is the useful part. The chloride estimate happens to match the net result, yet the calculation suggests two further contributions that oppose each other.
Suppose we now look at the measured lactate: 3 mmol/L. We can separate that out of the −5 residual:
−8 from Na−Cl + 5 from albumin − 3 from lactate − 2 remaining = −8
We have not discovered four separate diseases. We have arranged the measured composition into estimates that help us interpret the net result.
The remaining −2 does not prove that exactly 2 mmol/L of another acid is circulating. It is small enough that the approximations may account for it. Whether it needs further investigation depends on the rest of the patient: ketones, renal function, drugs, exposures and the clinical course.
The adjusted AG also pointed towards additional anions, and we could account for lactate in that calculation too. Story’s appeal is how clearly the opposing contributions appear in one sum. Its approximate residual need not be numerically identical to the excess adjusted AG.
When the contributions cancel
Now take a second, shorter example:
SBE 0, sodium 140, chloride 107 mmol/L, and albumin 22 g/L (2.2 g/dL).
The Na−Cl contribution is:
140 − 107 − 38 = −5
Albumin contributes +5. The two estimates cancel:
−5 + 5 = 0
The BE is normal because the net metabolic result is near zero. It does not tell us that each contribution is normal.
The same approach works in the alkalinising direction. A wider Na−Cl difference gives a more positive estimate. In a patient with vomiting or diuretic exposure, that may help us recognise a chloride-depletion pattern. We still need the history, potassium, volume assessment and renal context to explain how it arose and what to do about it.
Where the shortcut reaches its limit
I have seen acidosis and BE improve after sodium bicarbonate while the Na−Cl difference changed very little. That observation is awkward if we have reduced the entire explanation to “the sodium increases SID”. In that account, bicarbonate can sound chemically irrelevant.
As we saw in Part 2, we gave Na⁺ and HCO₃⁻. Bicarbonate participates directly: it takes up H⁺, and the resulting CO₂ requires removal. Calling bicarbonate a dependent variable does not make that reaction disappear. The strong-ion description and the bicarbonate reaction describe the same intervention; they are not separate alkalinising effects.
Nor is Na−Cl the full SID. It captures only two concentrations in plasma, whereas SBE estimates the metabolic disturbance across the extracellular fluid. The measured response also depends on how substances move between compartments.
The chloride shift we discussed in Part 2 illustrates why that distinction is important. As CO₂ and pH change, chloride and bicarbonate move between plasma and red cells. Experimental work shows that redistribution can change plasma SID without an equal change in whole-blood BE. A primary respiratory disturbance can therefore alter the calculated Na−Cl contribution and residual without a new metabolic acid load. Clinical studies show that this can distort the partition, particularly in marked acidaemia or alkalaemia.
These findings explain why we should not expect Na−Cl and BE always to move together. They do not establish what happened in my patients. For that, we would need paired measurements, their timing and the other changes occurring during treatment.
One consequence is certain. If SBE improves while the calculated Na−Cl and albumin contributions stay unchanged, the residual must become less negative, because we calculate it by subtraction.
Calling that “clearance of unmeasured acid” would turn an arithmetic result into an invented mechanism. The residual shows how much our estimates have left unexplained. It does not tell us what happened to it.
Back to the patient
A marked acid–base disturbance can impair cardiovascular function and increase the risk of arrhythmia. The speed of change, the underlying disease and the work required to sustain respiratory compensation all influence its clinical consequences.
An identical BE can accompany very different problems. A patient accumulating ketoacids needs different treatment from one who has received large volumes of saline. A patient with gastric losses has another physiological problem again.
The calculation should sharpen the questions we ask. Have the fluids contributed to relative chloride excess? Is lactate increasing or failing to clear? Are ketones present? Has renal function deteriorated? Does the drug history suggest an explanation we have overlooked?
Nor should we try to eliminate every calculated contribution. An alkalinising albumin effect is not, by itself, an indication to give albumin. A negative BE is not automatically a prescription for bicarbonate.
My bedside sequence for reading a blood gas is therefore:
1. pH — what is the net result?
Acidaemia or alkalaemia.
2. PCO₂ — what is the respiratory component doing?
High PCO₂ is acidifying. Low PCO₂ is alkalinising.
3. SBE — what is the metabolic component doing?
Negative SBE is acidifying. Positive SBE is alkalinising.
4. Story — what accounts for the metabolic component?
Estimate the contributions from Na−Cl and albumin, then calculate what remains.
Use this method a couple of times and you’ll see how quick and easy it is. It will allow you to explain almost the entire acid–base picture.
What I would teach
If you prefer the anion gap, keep using it. Account for albumin, include the measurements available and understand what the remaining gap represents.
But I think Story deserves to be taught early. The calculations are short, the signs show the direction of each contribution, and the sum connects directly to the BE on the report. Albumin around half normal? Allow about +5. A measured lactate? Put it into the sum. Then see how much of the metabolic result is still unexplained.
AG is established, often reported automatically, and can be calculated without BE. Those are good reasons for its continued use. My preference for Story comes from finding its presentation easier at the bedside, not from believing it reveals a different chemistry.
The photocopied article I was handed as a new trainee promised a deeper understanding of acid–base physiology. For me, the eventual reward has been this: looking at a result such as −8 and being able to explain what may be hidden inside it, then using that explanation to ask a better question about the patient.
One last wrinkle: temperature
Whilst a slight deviation from how to interpet a blood gas in usual practice it doesn’t seem right to do a 3 part series on acid-base without mentioning the effect of temperature.
Blood-gas analysers generally measure samples at 37°C. For a hypothermic patient, the corresponding values at their actual temperature have a higher pH and lower PCO₂.
Even pure water has a temperature-dependent neutral pH. The equilibrium:
H₂O ⇌ H⁺ + OH⁻
is temperature-dependent. At any fixed temperature, [H⁺] × [OH⁻] is approximately fixed, but that equilibrium constant changes with temperature. Around physiological temperatures, heating pure water increases dissociation, so H⁺ and OH⁻ both rise together; cooling does the opposite. The water remains neutral because the two concentrations remain equal, even though its neutral pH changes.
Unlike the fixed-temperature comparison in Part 2, temperature itself is now changing the water ion product, Kw, allowing H⁺ and OH⁻ in pure water to rise or fall together.
Blood also contains CO₂ and buffers whose equilibria change with temperature. A higher pH during cooling does not, by itself, establish a pathological alkalosis that needs correcting.
That creates a clinical question: should we accept the higher pH during cooling, or adjust CO₂ to bring it back towards 7.40?
Alpha-stat uses the values measured at 37°C to guide management, allowing actual-temperature pH to rise with cooling. pH-stat targets pH at the patient’s temperature, generally requiring more CO₂ during hypothermia, often supplied through the oxygenator during bypass.
The biological question goes beyond the water itself. Temperature also changes the proton-binding behaviour of proteins. The pKa of histidine imidazole groups shifts with temperature in roughly the same direction as neutral pH. Allowing pH to rise during cooling therefore helps preserve the proportion of these groups that have released their H⁺, and hence their charge state.
The same numerical pH at 30°C and 37°C does not represent the same degree of protein protonation. Maintaining 7.40 is therefore not automatically equivalent to maintaining the same biochemical state; the alpha-stat rationale concerns preserving protein ionisation rather than preserving one pH number.
Which strategy is preferable depends on the clinical setting. For this series, the useful lesson is that a target pH belongs to specified conditions.
Figge J, Jabor A, Kazda A, Fencl V. Anion gap and hypoalbuminemia. Critical Care Medicine. 1998;26:1807–1810.
Fencl V, Jabor A, Kazda A, Figge J. Diagnosis of metabolic acid–base disturbances in critically ill patients. American Journal of Respiratory and Critical Care Medicine. 2000;162:2246–2251.
Story DA, Morimatsu H, Bellomo R. Strong ions, weak acids and base excess: a simplified Fencl–Stewart approach to clinical acid–base disorders. British Journal of Anaesthesia. 2004;92:54–60.
Giosa L, Zadek F, Busana M, et al. Quantifying pH-induced changes in plasma strong ion difference during experimental acidosis: clinical implications for base excess interpretation. Journal of Applied Physiology. 2024;136:966–976.
Krbec M, Vančura M, Waldauf P, et al. Improving interpretation of metabolic acid–base disorders by correcting pH-dependent bias in base excess partitioning. British Journal of Anaesthesia. 2026;136:1451–1458.