


Look at an arterial pressure trace during mechanical ventilation and you’ll often see the pulse pressure change with each breath. We often refer to it as a ‘swing’. The variation can be subtle or striking. Clinicians recognised this long before monitors began displaying pulse pressure variation (PPV) or stroke volume variation (SVV).
A PPV of 16%, for example, is often taken to mean that the patient needs fluid.
Unlike several indices we’ve examined in this series, PPV and SVV have a sound physiological basis and a substantial body of supporting evidence. Under appropriate conditions, they can predict whether stroke volume will increase following volume expansion.
But there are numerous confounders, and surprisingly few critically ill patients meet all the conditions required for reliable interpretation. Even when the measurements are valid, the physiological behaviour they reveal is not specific to fluid administration. Vasopressors can also increase stroke volume while reducing respiratory variation, without adding blood to the circulation.
What exactly are we measuring, what causes the variation, and what can we conclude from it?
From an arterial swing to fluid responsiveness
In the early 1980s, investigators began examining respiratory changes in systolic arterial pressure as an indicator of circulating volume. Controlled positive-pressure ventilation provided a relatively consistent physiological perturbation with every breath.
In 1987, Perel, Pizov and Cotev demonstrated in ventilated dogs that systolic pressure variation (SPV) increased during progressive haemorrhage. They separated the variation into Δup and Δdown, which behaved differently as circulating volume was removed.
Clinical studies followed during the 1990s, including work by Tavernier and colleagues examining fluid responsiveness in patients with sepsis-induced hypotension.
In 2000, Michard and colleagues demonstrated that respiratory pulse pressure variation could predict the cardiac output response to volume expansion in mechanically ventilated patients with septic circulatory failure.
Interest in fluid responsiveness subsequently grew. Static measurements such as central venous pressure and ventricular dimensions were increasingly recognised as poor predictors of the response to volume expansion. In selected critically ill populations undergoing fluid challenges, only around half fulfilled conventional definitions of responsiveness.
Dynamic measurements offered something different. Rather than observing a pressure or volume at one instant, they examined how the circulation responded to a perturbation.
Interpreting that response requires understanding how mechanical ventilation interacts with the heart and vascular system.
What are PPV and SVV actually measuring?
Every cardiac contraction ejects blood into the arterial circulation. Arterial pressure rises as blood accumulates in the elastic arterial system, then falls as blood continues to flow into the peripheral circulation.
The difference between systolic and diastolic pressure is pulse pressure.
In Part 3 of this series, we examined how pulse pressure emerges from ventricular ejection interacting with arterial compliance, runoff and wave transmission.
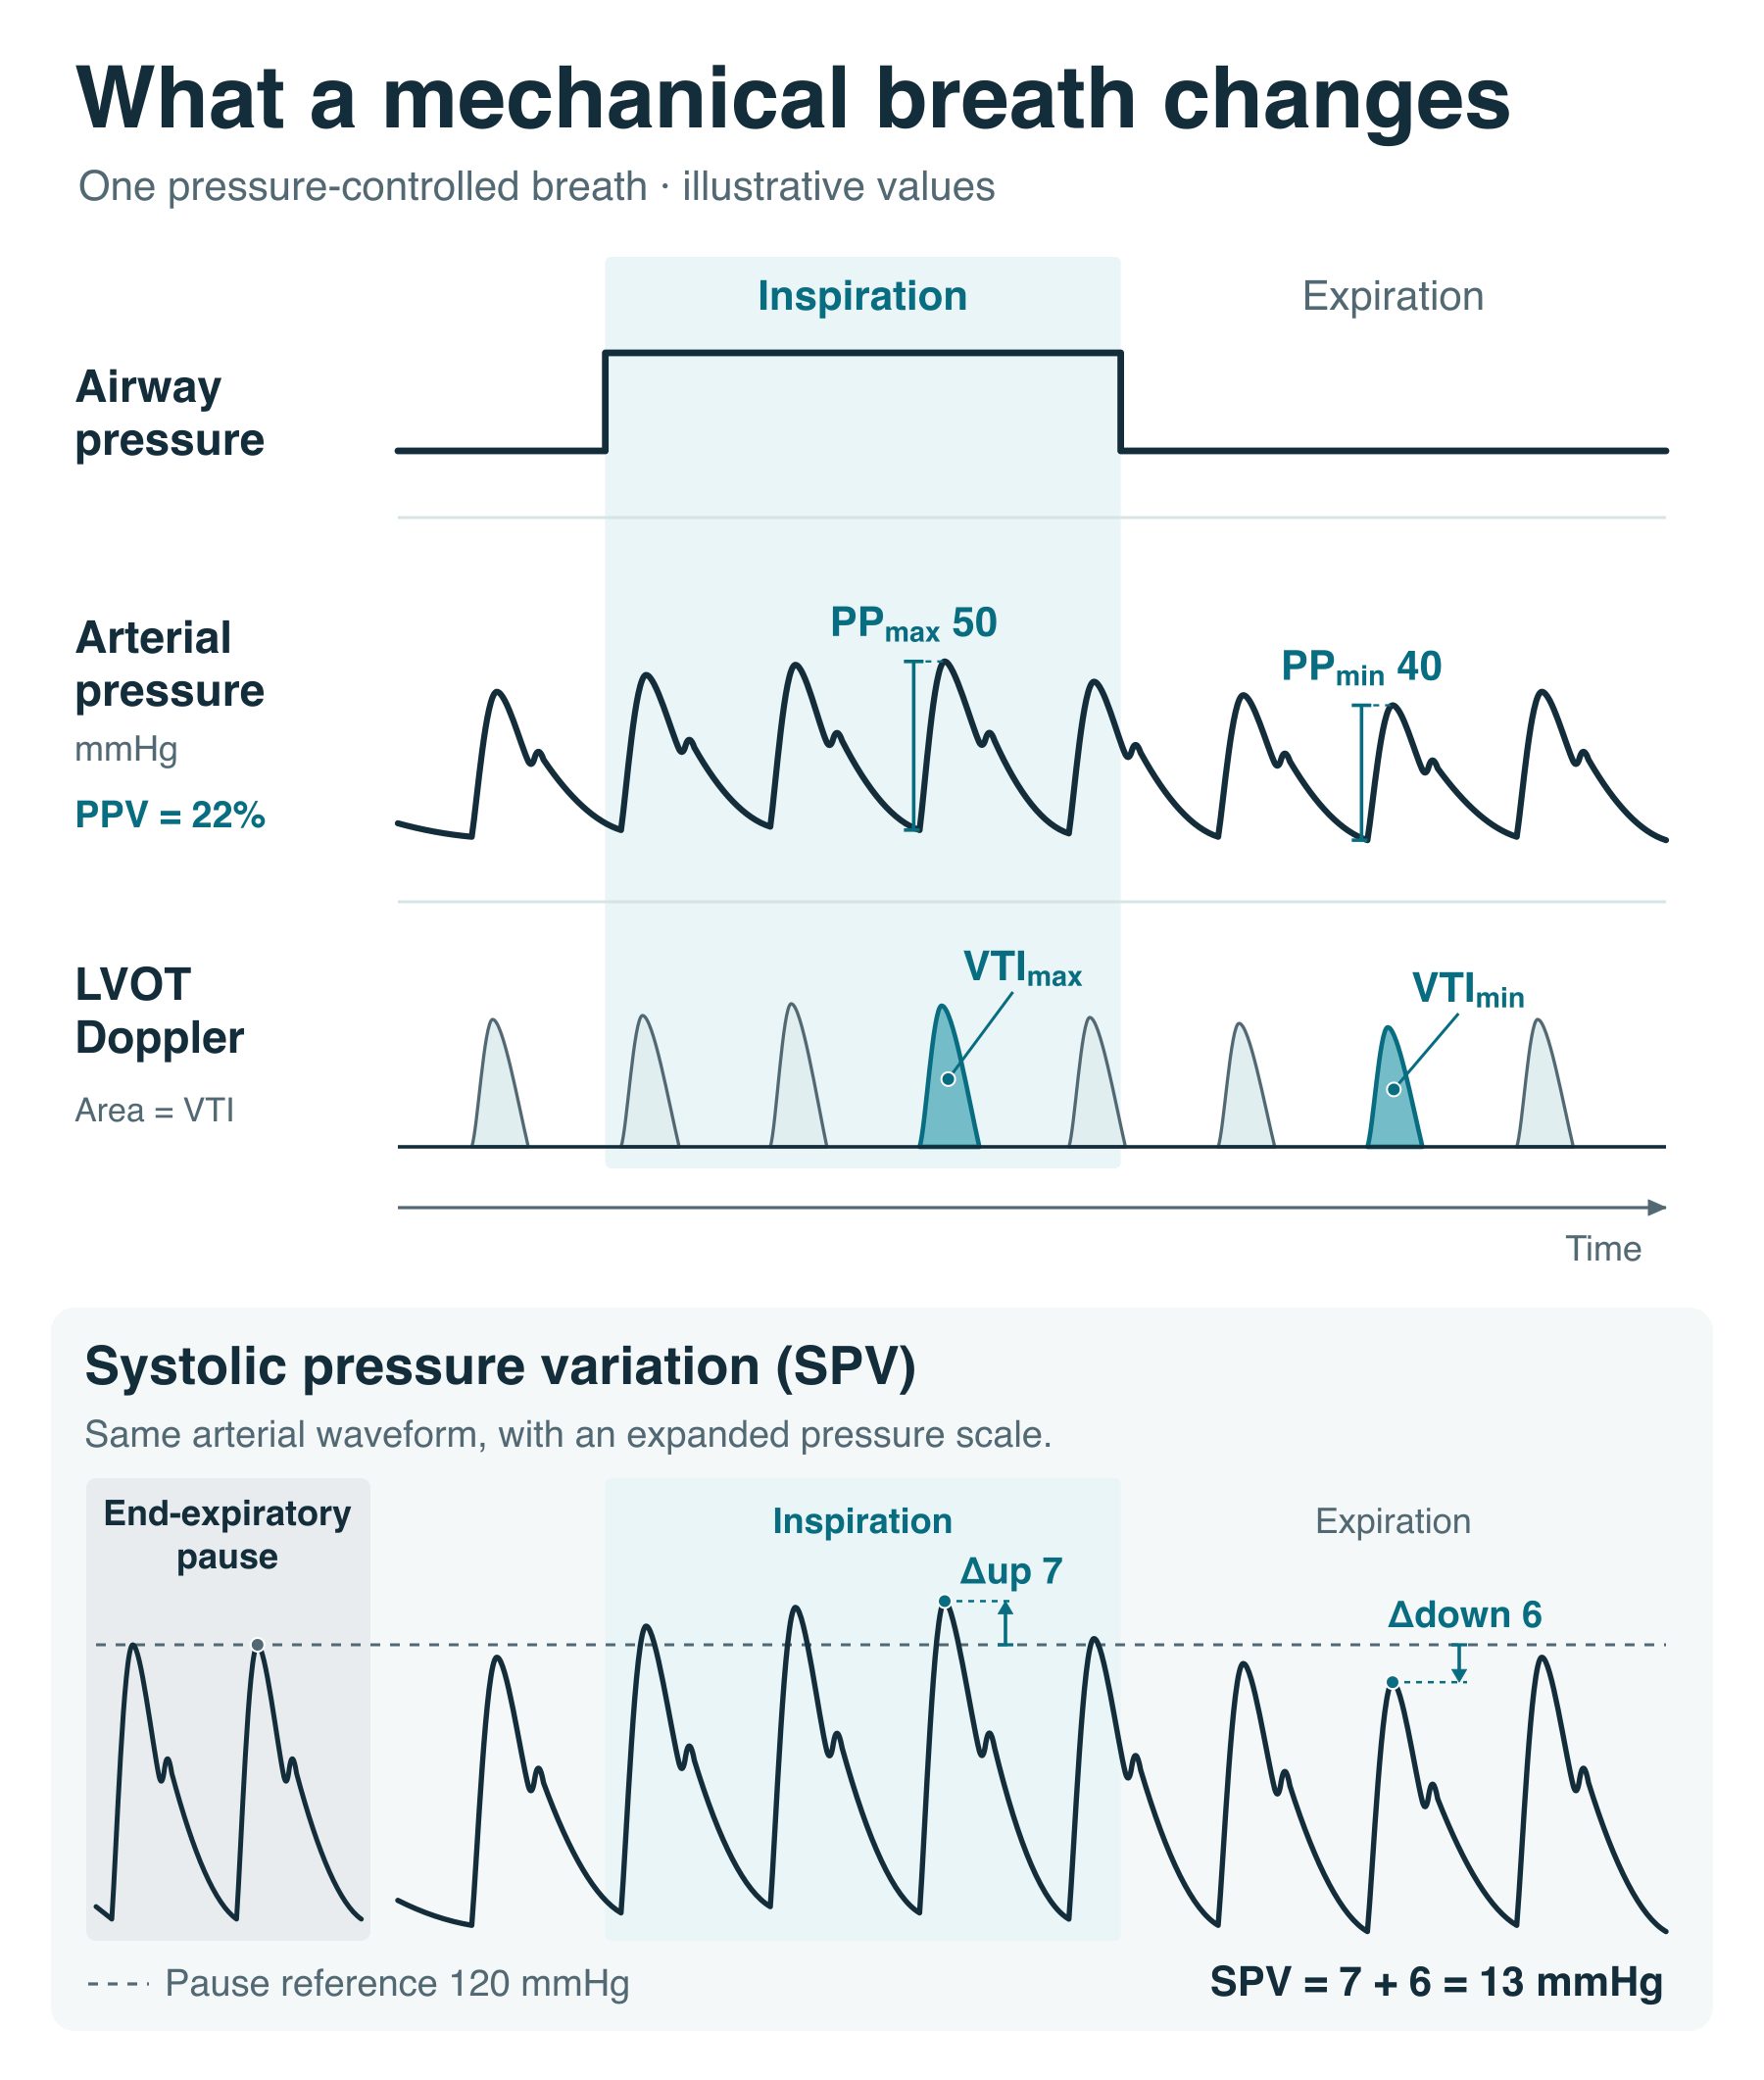
During positive-pressure ventilation, successive arterial waveforms may have different amplitudes. PPV expresses the difference between the largest and smallest pulse pressures as a percentage of their average.
PPV (%) = 100 × (PPmax − PPmin) / [(PPmax + PPmin) / 2]
For example, if the maximum pulse pressure during a respiratory cycle is 50 mmHg and the minimum is 40 mmHg, PPV is approximately 22%.
SVV uses essentially the same calculation, replacing pulse pressure with stroke volume. Depending on the monitoring system, the denominator may be the average of the extremes or the mean stroke volume over the measurement window.
PPV is calculated directly from the arterial pressure waveform. SVV requires beat-to-beat measurements or estimates of stroke volume.
Many monitors estimate stroke volume using pulse-contour analysis, deriving flow-related variables from the arterial waveform using assumptions about arterial mechanics. Consequently, PPV and SVV displayed together may not represent two independent observations.
Neither measurement directly quantifies circulating blood volume, mean systemic filling pressure, ventricular filling pressure or tissue perfusion. They quantify variation occurring during respiration.
What happens during positive-pressure inspiration?
Mechanical ventilation changes the loading conditions of both ventricles, pulmonary blood volume and vascular impedance, while influencing the relationship between ventricular ejection and measured arterial pressure. These effects do not occur simultaneously.
The right heart and venous circulation.
During positive-pressure inspiration, pleural pressure rises, increasing right atrial pressure. The increased external pressure can also narrow the intrathoracic great veins, increasing venous impedance and impeding blood entering the right heart. This is particularly likely when the upstream systemic pressure–volume state is low, whether from reduced circulating blood volume or increased venous accommodation.
These effects can be observed directly with ultrasound. The intrathoracic superior vena cava may narrow or collapse during inspiration, while the inferior vena cava below the diaphragm may instead distend. These observations led to SVC collapsibility and IVC distensibility being investigated as predictors of fluid responsiveness, notably by Vieillard-Baron and Barbier in 2004.
Inspiration also changes the pulmonary circulation.
Increasing transpulmonary pressure distends alveoli and can compress alveolar capillaries. Extra-alveolar vessels may respond differently as lung volume increases. The combined effect on pulmonary vascular resistance and impedance depends on lung volume, vascular conditions and the pressures generated during ventilation.
Increased alveolar distension can therefore increase RV afterload.
The right ventricle may eject less blood during inspiration because its filling is reduced, because the pulmonary circulation becomes more difficult to eject into, or because both occur simultaneously.
These mechanisms can produce similar changes in RV output despite representing different physiological disturbances.
The left ventricle
The initial effects on the left ventricle can be almost the opposite.
Positive-pressure inspiration may displace blood from parts of the pulmonary vascular compartment towards the left atrium, temporarily augmenting LV filling.
At the same time, increasing intrathoracic pressure reduces LV transmural systolic pressure for a given arterial pressure. The ventricle therefore has less pressure to develop relative to its surroundings during ejection.
This reduction in LV transmural afterload can increase stroke volume, particularly when LV ejection is sensitive to afterload.
We examined why arterial pressure alone is an inadequate description of ventricular afterload in The Afterload Problem.
Meanwhile, the reduction in RV output produced during inspiration has not yet reached the left ventricle. Blood must pass through the pulmonary circulation before a change in RV ejection alters LV filling. Its consequences therefore appear several heartbeats later, depending on pulmonary transit time, heart rate and respiratory frequency.
During conventional positive-pressure ventilation, LV stroke volume may initially increase during inspiration, then decrease as the reduction in RV output reaches the left heart.
The resulting arterial waveform reflects the combined effects of changing RV filling, RV afterload, pulmonary blood volume, LV filling and LV afterload.
Respiratory arterial pressure variation cannot automatically be attributed to changing venous return.
Δup and Δdown: what the original investigators recognised
The early systolic pressure variation (SPV) literature attempted to separate these different mechanisms.
Investigators measured systolic arterial pressure during a brief end-expiratory apnoea, then used that value as a reference.
Δup represented the increase in systolic pressure above the reference.
Δdown represented the decrease below it.
Δup could reflect increased LV filling from pulmonary blood displacement, reduced LV transmural afterload or the effects of changing pressure around the thoracic aorta.
Δdown was generally associated with the delayed reduction in LV filling and ejection following the inspiratory reduction in RV output.
In the original experiments, haemorrhage increased Δdown. Restoring circulating volume reduced it.
The behaviour during LV failure was different. A failing, afterload-sensitive LV could eject more effectively when inspiration reduced transmural afterload, producing a more prominent Δup.
This raises an interesting possibility. Respiratory pressure variation might sometimes reflect sensitivity to LV afterload rather than increased filling.
However, the experimental findings were not as simple as LV failure producing false-positive pressure variation. In experiments published in 1989, LV failure reduced total SPV because Δdown became smaller, even though Δup became the dominant component.
The LV afterload mechanism is therefore established, but it does not follow that LV failure necessarily exaggerates PPV.
The Δup/Δdown distinction belongs to systolic pressure variation rather than PPV itself. Nevertheless, it helps explain why investigators moved towards pulse pressure as a potentially more useful signal.
Does pulse pressure variation actually represent stroke volume variation?
Measured systolic pressure can change when intrathoracic pressure changes, even without an equivalent change in stroke volume.
For example, increasing pressure around the thoracic aorta can increase its measured intraluminal pressure without producing an equivalent change in transmural distending pressure.
Pulse pressure partly removes effects that influence systolic and diastolic pressures similarly, because it measures the difference between them. This makes PPV a closer approximation to variation in stroke volume than SPV alone. But it remains an approximation.
As we saw in Part 3, in a simplified elastic arterial reservoir, pulse pressure is approximately proportional to stroke volume divided by arterial compliance:
PP ≈ SV / C
If compliance remains constant throughout the respiratory cycle, and the other assumptions of the model hold, percentage variation in pulse pressure will closely follow percentage variation in stroke volume.
Arterial stiffness alone does not invalidate this relationship. A stiffer arterial system produces a larger absolute pulse pressure for the same stroke volume, but if the relationship between pressure and volume remains constant across successive beats, percentage variation can still reflect percentage variation in stroke volume.
Real arteries are considerably more complicated. Compliance changes with operating pressure. Peripheral runoff continues during ventricular ejection. Characteristic impedance, wave reflection and the timing of ejection influence the pressure measured at a particular arterial location.
Consequently, two circulations with the same respiratory variation in stroke volume need not produce identical PPV.
Nevertheless, the approximation can work remarkably well.
In 2011, Mesquida, Kim and Pinsky measured aortic and pulmonary arterial flow directly in ventilated dogs while altering tidal volume, chest-wall mechanics and cardiac contractility.
Arterial pulse pressure tracked LV stroke volume closely across the experimental conditions, with an r² of 0.85. The study also demonstrated the delayed LV stroke volume response following changes in RV output, generally occurring two to three beats later.
PPV can therefore provide useful information about respiratory changes in stroke volume despite measuring pressure rather than flow.
An earlier experiment illustrates why vascular conditions still require consideration.
In 1988, Pizov, Ya’ari and Perel compared SPV in ventilated dogs made hypotensive by haemorrhage or sodium nitroprusside. Mean arterial pressure was reduced to approximately 50 mmHg in both groups, but SPV was greater during haemorrhage.
These interventions produced different vascular states. Haemorrhage reduced circulating volume and provoked compensatory responses, while nitroprusside changed both venous accommodation and arterial loading. The haemorrhage group also had lower cardiac output and higher systemic vascular resistance.
The study could not establish how much of the difference in SPV arose from changing ventricular ejection and how much from the arterial response to that ejection. It did not establish a unique waveform signature of hypovolaemia.
When SVV is calculated from the same arterial waveform, it remains dependent on assumptions about how pressure relates to flow.
Respiratory variation in LVOT VTI
Echocardiography provides another way to examine respiratory changes in ventricular output.
The left ventricular outflow tract velocity–time integral (LVOT VTI) measures the distance travelled by blood through the LVOT during systole.
Stroke volume is calculated by multiplying VTI by the LVOT cross-sectional area.
Provided that area remains approximately constant, respiratory variation in VTI reflects variation in stroke volume without relying on the mechanical properties of the arterial circulation.
We can therefore measure the maximum and minimum LVOT VTI (or even just peak velocity variation) during controlled ventilation and examine how much it varies with respiration.
This provides a more direct assessment of respiratory variation in forward flow than PPV.
However, the physiological limitations remain. The same changes in RV loading, pulmonary transit and LV afterload are producing the variation. Doppler measurements also introduce their own technical limitations, particularly when the variation is small.
Respiratory VTI variation should not be confused with measuring the change in VTI following passive leg raising or a fluid bolus. Those are different perturbations.
So what can PPV and SVV predict?
Despite these complexities, PPV and SVV have a substantial evidence base.
In selected mechanically ventilated patients, greater respiratory variation is associated with a greater probability of increasing stroke volume following volume expansion.
In the original 2000 study, Michard and colleagues classified 16 of 40 patients as responders using an increase in cardiac index of at least 15% following volume expansion.
A 2024 systematic review and meta-analysis reported an AUC of 0.87 for PPV across 40 studies. The average predictive threshold was approximately 11.5%.
SVV performed similarly, with an AUC of 0.87 across 24 studies.
An AUC of 0.87 represents good discrimination between patients who meet a specified definition of fluid responsiveness and those who do not. It does not mean that 87% of individual predictions are correct, and it does not establish a universal threshold.
A 2023 meta-analysis of operating-room studies found more modest performance, including an AUC of 0.76 for SVV.
Diagnostic grey zones were also substantial. Among the studies reporting them, the median proportions of patients falling within the grey zones were 56% for PPV and 57% for SVV.
These measurements can predict an actual physiological response, but their ability to classify an individual patient depends on the circumstances.
Many critically ill patients do not satisfy the conditions under which the measurements perform best.
When does the measurement become unreliable?
The conventional list of limitations is extensive, but they do not all interfere with interpretation in the same way.
An inadequate respiratory perturbation
PPV and SVV require mechanical ventilation to produce a sufficiently large and consistent change in cardiac loading.
With low tidal volume ventilation, the resulting disturbance may be too small to reveal substantial variation.
A patient can therefore have a low PPV despite retaining considerable capacity to increase stroke volume when systemic delivery increases.
A systematic review of low tidal volume ventilation reported reduced predictive performance for PPV.
Respiratory mechanics further complicate the relationship. Airway pressure is not pleural pressure, and the fraction of airway pressure transmitted to the pleural space depends on lung and chest wall mechanics.
A temporary increase in tidal volume — the tidal-volume challenge — can sometimes improve discrimination, but it is a separate manoeuvre with its own interpretation.
An inconsistent perturbation
Spontaneous respiratory activity introduces negative pleural pressure swings with different effects on ventricular loading from controlled positive-pressure ventilation. The timing and magnitude of respiratory effort also vary.
Arrhythmias introduce beat-to-beat changes in ventricular filling and stroke volume independently of respiration.
A low heart-rate-to-respiratory-rate ratio creates another problem because too few cardiac cycles occur during each respiratory cycle to characterise the variation reliably.
Altered cardiopulmonary mechanics
Opening the chest changes the mechanical environment in which ventilation acts on the heart. Pleural pressure transmission, ventricular constraint and the relationship between airway pressure and cardiac loading are altered.
Studies of PPV and SVV during open-chest cardiothoracic surgery have produced inconsistent results, with systematic reviews finding reduced or unreliable predictive performance.
Raised intra-abdominal pressure can also change venous pressure relationships and pressure transmission, making conventional thresholds unreliable.
When RV afterload produces the variation
Right ventricular dysfunction deserves particular attention because it can produce a false-positive result.
During positive-pressure inspiration, increased pulmonary vascular impedance may substantially reduce RV ejection.
After pulmonary transit, LV filling and stroke volume fall, producing considerable respiratory arterial pressure variation.
But the dominant disturbance may be the RV’s inability to eject against an increased pulmonary vascular load, rather than insufficient upstream delivery.
Fluid administration may fail to increase cardiac output. Worse, it may increase RV distension, impair ventricular interaction and worsen systemic venous congestion.
In a 2009 study, Mahjoub and colleagues found that patients with elevated PPV who failed to respond to fluid had lower indices of RV systolic function, supporting RV dysfunction as a cause of misleading variation.
A large PPV produced by RV afterload sensitivity cannot be interpreted in the same way as a large PPV produced predominantly by changes in filling. The arterial waveform does not distinguish these mechanisms.
How often can we actually use PPV?
In 2014, Mahjoub and colleagues published a prospective multicentre study in the British Journal of Anaesthesia examining how often critically ill patients satisfied the criteria for conventional PPV interpretation. They assessed 311 patients across 26 French ICUs.
The criteria included controlled mechanical ventilation without spontaneous effort, regular rhythm, tidal volume of at least 8 mL/kg ideal body weight, an appropriate heart-rate-to-respiratory-rate ratio, sufficient respiratory compliance and preserved RV systolic function by their chosen criterion.
Only six patients — 2% — satisfied every criterion. Among patients with an arterial catheter, the proportion was 3%.
A subsequent multicentre study in 2016 examined the applicability of PPV during haemodynamic instability. Only 12 of 163 unstable episodes, approximately 7%, satisfied all its predefined conditions.
These studies used strict criteria, and some limitations can be overcome through additional manoeuvres. They do not demonstrate that PPV is clinically useful in only 2–7% of ICU patients. But they expose a substantial practical limitation.
A monitor can calculate PPV continuously, irrespective of whether the physiological conditions required for interpreting it are satisfied.
The displayed number may be mathematically correct while its clinical interpretation is unreliable.
Is substantial arterial pressure variation necessarily abnormal?
There is another assumption worth examining: that demonstrating responsiveness identifies a pathological haemodynamic state.
It is entirely normal for a healthy circulation to have some capacity to increase cardiac output when upstream delivery increases.
In a 2016 study of 40 fasting healthy volunteers, 90% increased stroke volume by at least 10% following a fluid bolus.
A 2023 study found that approximately two-thirds of healthy volunteers increased stroke volume by at least 10% during passive leg raising.
Other studies have found lower proportions, depending on posture, fasting, the intervention and the threshold used to define responsiveness.
But responsiveness does not require hypovolaemia or circulatory failure.
Can substantial PPV also occur in relatively healthy patients?
A 2017 study in Anesthesiology examined arterial pressure variation during 1,791 elective noncardiac anaesthetics. Automated PPV data were available for 468 cases.
The median of the per-case median PPV values was 7%, with a 95% reference interval extending from 2% to 16%.
The upper end therefore overlapped with values commonly interpreted as predicting fluid responsiveness.
These patients were anaesthetised, so vascular tone and cardiac loading were not necessarily equivalent to their normal awake state. Nevertheless, substantial PPV occurred in a relatively healthy surgical population.
There is a useful comparison with echocardiography.
A small, hyperdynamic left ventricle may suggest that cardiac output could increase if upstream delivery increased. But neither a small ventricular cavity nor a high ejection fraction establishes why the circulation has that appearance.
The patient might have lost blood, or the circulation might be profoundly vasodilated.
PPV is a dynamic observation and, under suitable conditions, provides stronger evidence of loading sensitivity than a static echocardiographic appearance.
But neither establishes that additional delivery is required.
Fluid responsiveness, or delivery responsiveness?
This brings us back to the interpretation attached to PPV and SVV.
They are conventionally described as predictors of fluid responsiveness. But fluid is only one way of altering the systemic vascular pressure–volume state.
In The Pressure–Volume State and From Pressure–Volume State to Venous Return, we examined how circulating blood volume and vascular pressure–volume behaviour establish the systemic elastic state, represented at zero flow by mean systemic filling pressure (Pms).
Fluid administration adds volume and generally increases Pms.
Venoconstriction changes the pressure–volume relationship itself, reducing the amount of blood accommodated within the venous compartment at the relevant pressures. Blood redistributes elsewhere within the connected circulation without any increase in total blood volume. If the heart can accept this redistribution and transfer more blood onward, cardiac output rises.
These mechanisms are developed in What Actually Happens When We Give Fluid or Vasopressors?.
What happens when we give a vasopressor instead?
Clinical studies have demonstrated that vasopressors can increase stroke volume while reducing respiratory variation.
In 2010, Hamzaoui and colleagues examined the effects of initiating or increasing norepinephrine in 105 patients with severe septic hypotension.
Cardiac index increased from 3.2 to 3.6 L/min/m², while stroke volume index increased from 34 to 39 mL/m². Global end-diastolic volume also increased.
In the 59 mechanically ventilated patients in whom SVV was recorded, it decreased from 13% to 9%.
Stroke volume increased, and respiratory stroke volume variation decreased, without a further fluid challenge.
In 2013, Maas and colleagues examined the response to norepinephrine in 16 mechanically ventilated postoperative cardiac surgery patients.
Six patients, whose baseline SVV averaged 14.4%, increased stroke volume and cardiac output. In the remaining ten, baseline SVV averaged 9.1%. Their stroke volume remained essentially unchanged, while cardiac output fell predominantly because heart rate decreased.
Baseline SVV predicted the direction of the cardiac output response with an AUC of 0.90, although the sample was small.
SVV decreased in both groups following norepinephrine, while estimated Pms increased. Initial SVV therefore contained information about the probability of increasing output following venoconstriction, but a subsequent reduction in SVV did not necessarily indicate increased stroke volume.
The effect is not confined to norepinephrine.
In a 2018 study of patients with anaesthesia-induced hypotension, phenylephrine increased estimated stroke volume and cardiac output. Among the 18 patients analysed, PPV fell from 20% to 9%, while SVV fell from 19% to 11%.
Again, circulating blood volume had not been increased.
Other studies have found that phenylephrine can reduce PPV without significantly increasing stroke volume, reinforcing that a change in respiratory pressure variation does not necessarily establish a change in flow.
These observations fit the effects of venoconstriction on the systemic pressure–volume state. By reducing venous accommodation, vasopressors can redistribute circulating volume and potentially allow the heart to increase its output.
In suitable vasodilated patients, this can be demonstrated at the bedside. Increasing norepinephrine produces an increase in stroke volume accompanied by a reduction in PPV or SVV, without giving fluid.
The response is not inevitable. Vasopressors also change arterial load, venous impedance and potentially cardiac contractility. If the heart cannot accept the altered delivery, or the opposing effects outweigh the benefit, cardiac output may fail to increase or may decrease.
Changing arterial properties can also alter PPV independently of stroke volume, while SVV derived from an arterial waveform is not entirely independent.
There are fewer studies examining responses to vasopressors than to fluid administration, but they demonstrate that PPV and SVV can decrease while cardiac output increases following an intervention that changes vascular tone without increasing circulating blood volume.
The same PPV, different underlying disturbances
Consider three patients with identical PPV values of 16%.
One has suffered substantial haemorrhage. Circulating volume is reduced, and compensatory sympathetic venoconstriction may already be considerable. Restoring the missing volume is likely to be an effective way of increasing the pressure-volume state.
A second has profound venodilation with relatively preserved circulating volume. The venous compartment accommodates more blood at lower pressure. Venoconstriction will therefore be a more effective intervention.
Both disturbances can reduce upstream delivery, and both can produce a circulation whose output is sensitive to changes in loading.
A third patient has a dilated, failing right ventricle. Positive-pressure inspiration increases RV afterload, producing marked respiratory variation in RV ejection and, subsequently, LV stroke volume. But in this patient, increasing upstream delivery produces little or no increase in output, and additional fluid may worsen RV distension and venous congestion. The elevated PPV is a false positive for fluid responsiveness.
A given PPV therefore cannot distinguish between reduced circulating volume, increased venous accommodation and impaired RV function. It does not even guarantee responsiveness to increased delivery. And when it does reflect sensitivity to upstream delivery, that physiological behaviour is not specific to fluid administration.
Back to the arterial waveform
Let’s return to our original patient.
The monitor displays a PPV of 16%. Unusually, this patient meets the conditions for reliable interpretation: a regular rhythm, controlled ventilation, sufficient tidal volume, and no significant RV dysfunction or other major confounder.
Under these conditions, the measurement provides useful evidence that stroke volume is likely to increase following volume expansion.
But it cannot establish whether the patient needs additional flow, whether increasing cardiac output would improve tissue perfusion, or whether administering fluid would be the best way to achieve it.
A substantial respiratory swing on the arterial line is worth noticing. It tells us something about how ventricular output responds to the changing conditions produced by mechanical ventilation. PPV simply quantifies that observation.
The rest requires understanding the circulation. And, as we’ll see in the final episode of this series, there are more direct ways to do that.
References
Perel A, Pizov R, Cotev S (1987). Systolic blood pressure variation is a sensitive indicator of hypovolemia in ventilated dogs subjected to graded hemorrhage. Anesthesiology.
Michard F et al. (2000). Relation between respiratory changes in arterial pulse pressure and fluid responsiveness in septic patients with acute circulatory failure. American Journal of Respiratory and Critical Care Medicine.
Mesquida J, Kim HK, Pinsky MR (2011). Effect of tidal volume, intrathoracic pressure, and cardiac contractility on variations in pulse pressure, stroke volume, and intrathoracic blood volume. Intensive Care Medicine.
Miller A, Mandeville J (2016). Predicting and measuring fluid responsiveness with echocardiography. Echo Research and Practice.
Chaves RCF et al. (2024). Assessment of fluid responsiveness using pulse pressure variation, stroke volume variation, plethysmographic variability index, central venous pressure, and inferior vena cava variation in patients undergoing mechanical ventilation: a systematic review and meta-analysis. Critical Care.
Mahjoub Y et al. (2009). Assessing fluid responsiveness in critically ill patients: false-positive pulse pressure variation is detected by Doppler echocardiographic evaluation of the right ventricle. Critical Care Medicine.
Mahjoub Y et al. (2014). Evaluation of pulse pressure variation validity criteria in critically ill patients: a prospective observational multicentre point-prevalence study. British Journal of Anaesthesia.
Pranskunas A et al. (2023). Differences in hemodynamic response to passive leg raising tests during the day in healthy individuals: the question of normovolemia. Life.
Mathis MR et al. (2017). Arterial pressure variation in elective noncardiac surgery: identifying reference distributions and modifying factors. Anesthesiology.
Hamzaoui O et al. (2010). Early administration of norepinephrine increases cardiac preload and cardiac output in septic patients with life-threatening hypotension. Critical Care.
Maas JJ et al. (2013). Cardiac output response to norepinephrine in postoperative cardiac surgery patients: interpretation with venous return and cardiac function curves. Critical Care Medicine.
Kalmar AF et al. (2018). Phenylephrine increases cardiac output by raising cardiac preload in patients with anesthesia induced hypotension. Journal of Clinical Monitoring and Computing.